SA Stock Market News
Seeking Alpha (17,408)
INSTALL
Already have the App? Tap here to open
Sign In / Sign Up
Home
Stock Ideas
Transcripts
Market Outlook
Portfolio Strategy
Dividends
Investing Strategy
ETFs & Funds
Wall Street Breakfast
Latest Articles
Market News
Desktop Version
Analysis
Search Symbols
Kwan-Chen Ma
Happy New Year Nvidia
Dec. 27, 2017 10:40 AM • NVDA
Summary
There is a recurring concern regarding whether Nvidia’s high valuation is justified by its future fundamentals.
Based on 2018 forecast fundamentals, Nvidia’s GPU segment is valued at $210 per share and Tegra Processor at $37 per share.
Nvidia’s Gaming segment is valued at $160 per share, Datacenter at $56, and OEM & IP, Professional Visualization and Automobile combined at $45.
Using the "Sum of Parts" valuation method, Nvidia’s 2018 price target is between $252 and $261 per share.

No one would argue with the fact that Nvidia (NASDAQ: NVDA) has had a spectacular 2017. Nvidia beat its fiscal 3Q sales and earnings estimates, and 4Q guidance exceeded consensus. Company revenue has soared more than 36% and the stock more than 90%. At this point, the most common concern is on the NVDA’s seemingly high valuation which may not be justified by its forecast fundamentals. In this article, I just attempt to answer this question. Based on both the product classification and the end users classification, I use the “sum of parts” method to estimate NVDA’s 2018 price targets.
Murphy’s Law Rules
The good news is that NVDA fended off AMD’s recent assault on GPU market shares and be proven to be less affected by the volatility of the Bitcoin market. All segments across the board have delivered growth rates exceeding expectations. Ironically, Nvidia’s only potential bad news may be a result of its own success. Small revenue share segment shows the largest growth potential, Datacenter delivered over 100% year to year revenue growth (Figure 1-A) but only represents the smallest end user, contributing less than 20% of the revenue 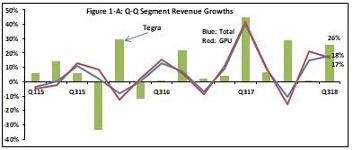
While Nvidia’s GPU business represents 84% of the Q3 revenue, it also dictates the company’s 18% year-to-year revenue growth which is significantly lower than the 74% Tegra Processor growth rate. As a result, Nvidia's near-term overall growth rate may be invariably slowing down amid the “growth dilution” from a large revenue base.
Forward-Looking Segment Fundamentals
In the following sections, I will examine the 2018 growth outlook for Nvidia's largest or fastest growing segments.
Gaming
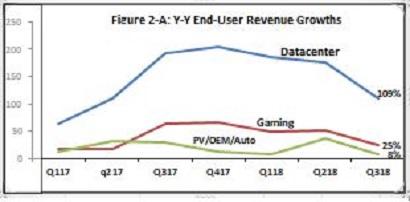
Gaming is still Nvidia’s largest revenue segment. It increased from 41% in 2015 to the most recent 59% (Figure 1-B). On the other hand, Gaming also has the lower growth rate at 26%, halved from 50% just one year ago (Figure 2-A). However, gaming growth is expected to continue due to upgrades to chips that use Nvidia's Pascal and Maxwell GPU architecture and positioning vs. AMD's.
Seeking Alpha (17,408)
INSTALL
Already have the App? Tap here to open
Sign In / Sign Up
Home
Stock Ideas
Transcripts
Market Outlook
Portfolio Strategy
Dividends
Investing Strategy
ETFs & Funds
Wall Street Breakfast
Latest Articles
Market News
Desktop Version
Analysis
Search Symbols
Kwan-Chen Ma
Happy New Year Nvidia
Dec. 27, 2017 10:40 AM • NVDA
Summary
There is a recurring concern regarding whether Nvidia’s high valuation is justified by its future fundamentals.
Based on 2018 forecast fundamentals, Nvidia’s GPU segment is valued at $210 per share and Tegra Processor at $37 per share.
Nvidia’s Gaming segment is valued at $160 per share, Datacenter at $56, and OEM & IP, Professional Visualization and Automobile combined at $45.
Using the "Sum of Parts" valuation method, Nvidia’s 2018 price target is between $252 and $261 per share.
Advertisement
No one would argue with the fact that Nvidia (NASDAQ: NVDA) has had a spectacular 2017. Nvidia beat its fiscal 3Q sales and earnings estimates, and 4Q guidance exceeded consensus. Company revenue has soared more than 36% and the stock more than 90%. At this point, the most common concern is on the NVDA’s seemingly high valuation which may not be justified by its forecast fundamentals. In this article, I just attempt to answer this question. Based on both the product classification and the end users classification, I use the “sum of parts” method to estimate NVDA’s 2018 price targets.
Murphy’s Law Rules
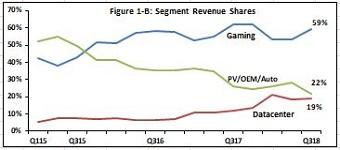
The good news is that NVDA fended off AMD’s recent assault on GPU market shares and be proven to be less affected by the volatility of the Bitcoin market. All segments across the board have delivered growth rates exceeding expectations. Ironically, Nvidia’s only potential bad news may be a result of its own success. Small revenue share segment shows the largest growth potential, Datacenter delivered over 100% year to year revenue growth (Figure 1-A) but only represents the smallest end user, contributing less than 20% of the revenue (Figure 1-B).
(Source: Bloomberg)
While Nvidia’s GPU business represents 84% of the Q3 revenue, it also dictates the company’s 18% year-to-year revenue growth which is significantly lower than the 74% Tegra Processor growth rate. As a result, Nvidia's near-term overall growth rate may be invariably slowing down amid the “growth dilution” from a large revenue base.
(Source: Bloomberg)
Forward-Looking Segment Fundamentals
In the following sections, I will examine the 2018 growth outlook for Nvidia's largest or fastest growing segments.
Gaming
Gaming is still Nvidia’s largest revenue segment. It increased from 41% in 2015 to the most recent 59% (Figure 1-B). On the other hand, Gaming also has the lower growth rate at 26%, halved from 50% just one year ago (Figure 2-A). However, gaming growth is expected to continue due to upgrades to chips that use Nvidia's Pascal and Maxwell GPU architecture and positioning vs. AMD's.
(Source: Bloomberg)
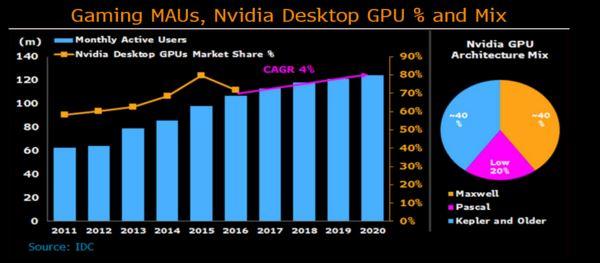
As the popularity of e-sports increases the demand for mid-range and higher GPUs, the 3-5 years GPU refresh cycle, and matching product releases, the company expects that its gaming revenue will grow in a mid-teen rate. While the IDC predicts PC gamers will rise 4% a year through 2020, Nvidia’s desktop GPU market share will reach 80% by then in figure below. Since MAU is highly correlated with the desktop GPU sales, it stands to reason that Nvidia’s long-term GPU’s CAGR will be halved from the most recent 25% to 12%-14%. The company’s gaming sales rose 13% a year during the past five years.
In the meantime, Nvidia fully enjoys the “margin leverage” that operating margin increases with the revenue growth (Figure 8 and 1-C). I can only see that Nvidia’s early investment in Artificial Intelligence (NYSE:AI) will start paying off. With a steadily rising margin at 44%, it is expected that the GPU’s 2018 operating margin will exceed 45%.