As the halving occurred a few days ago, it is now time to re-analyse the graphs and to try to fix some objectives. This analysis will somehow be the evolution of the previous one published 48h before the halving : [ETH & BTC - Pre-halving update ](https://peakd.com/hive-167922/@blesspatrick/eth-and-btc-pre-halving-update) This analysis will be full with lot of informations using analysis based on Fibonacci's number, Gann's diagrams, EMAs 9-26-50-100-200-500, Ichimoku's cloud and technical drawings. The objective is to try to get the most complete image of the market to be able to fix everyone's trading plan on it. ___ ### Plan 1. Long term cycles 2. Weekly TA 3. Daily TA 4. Conclusion 5. Final word ___ ### Long term cycles **Daily MA 1000-1400 close** 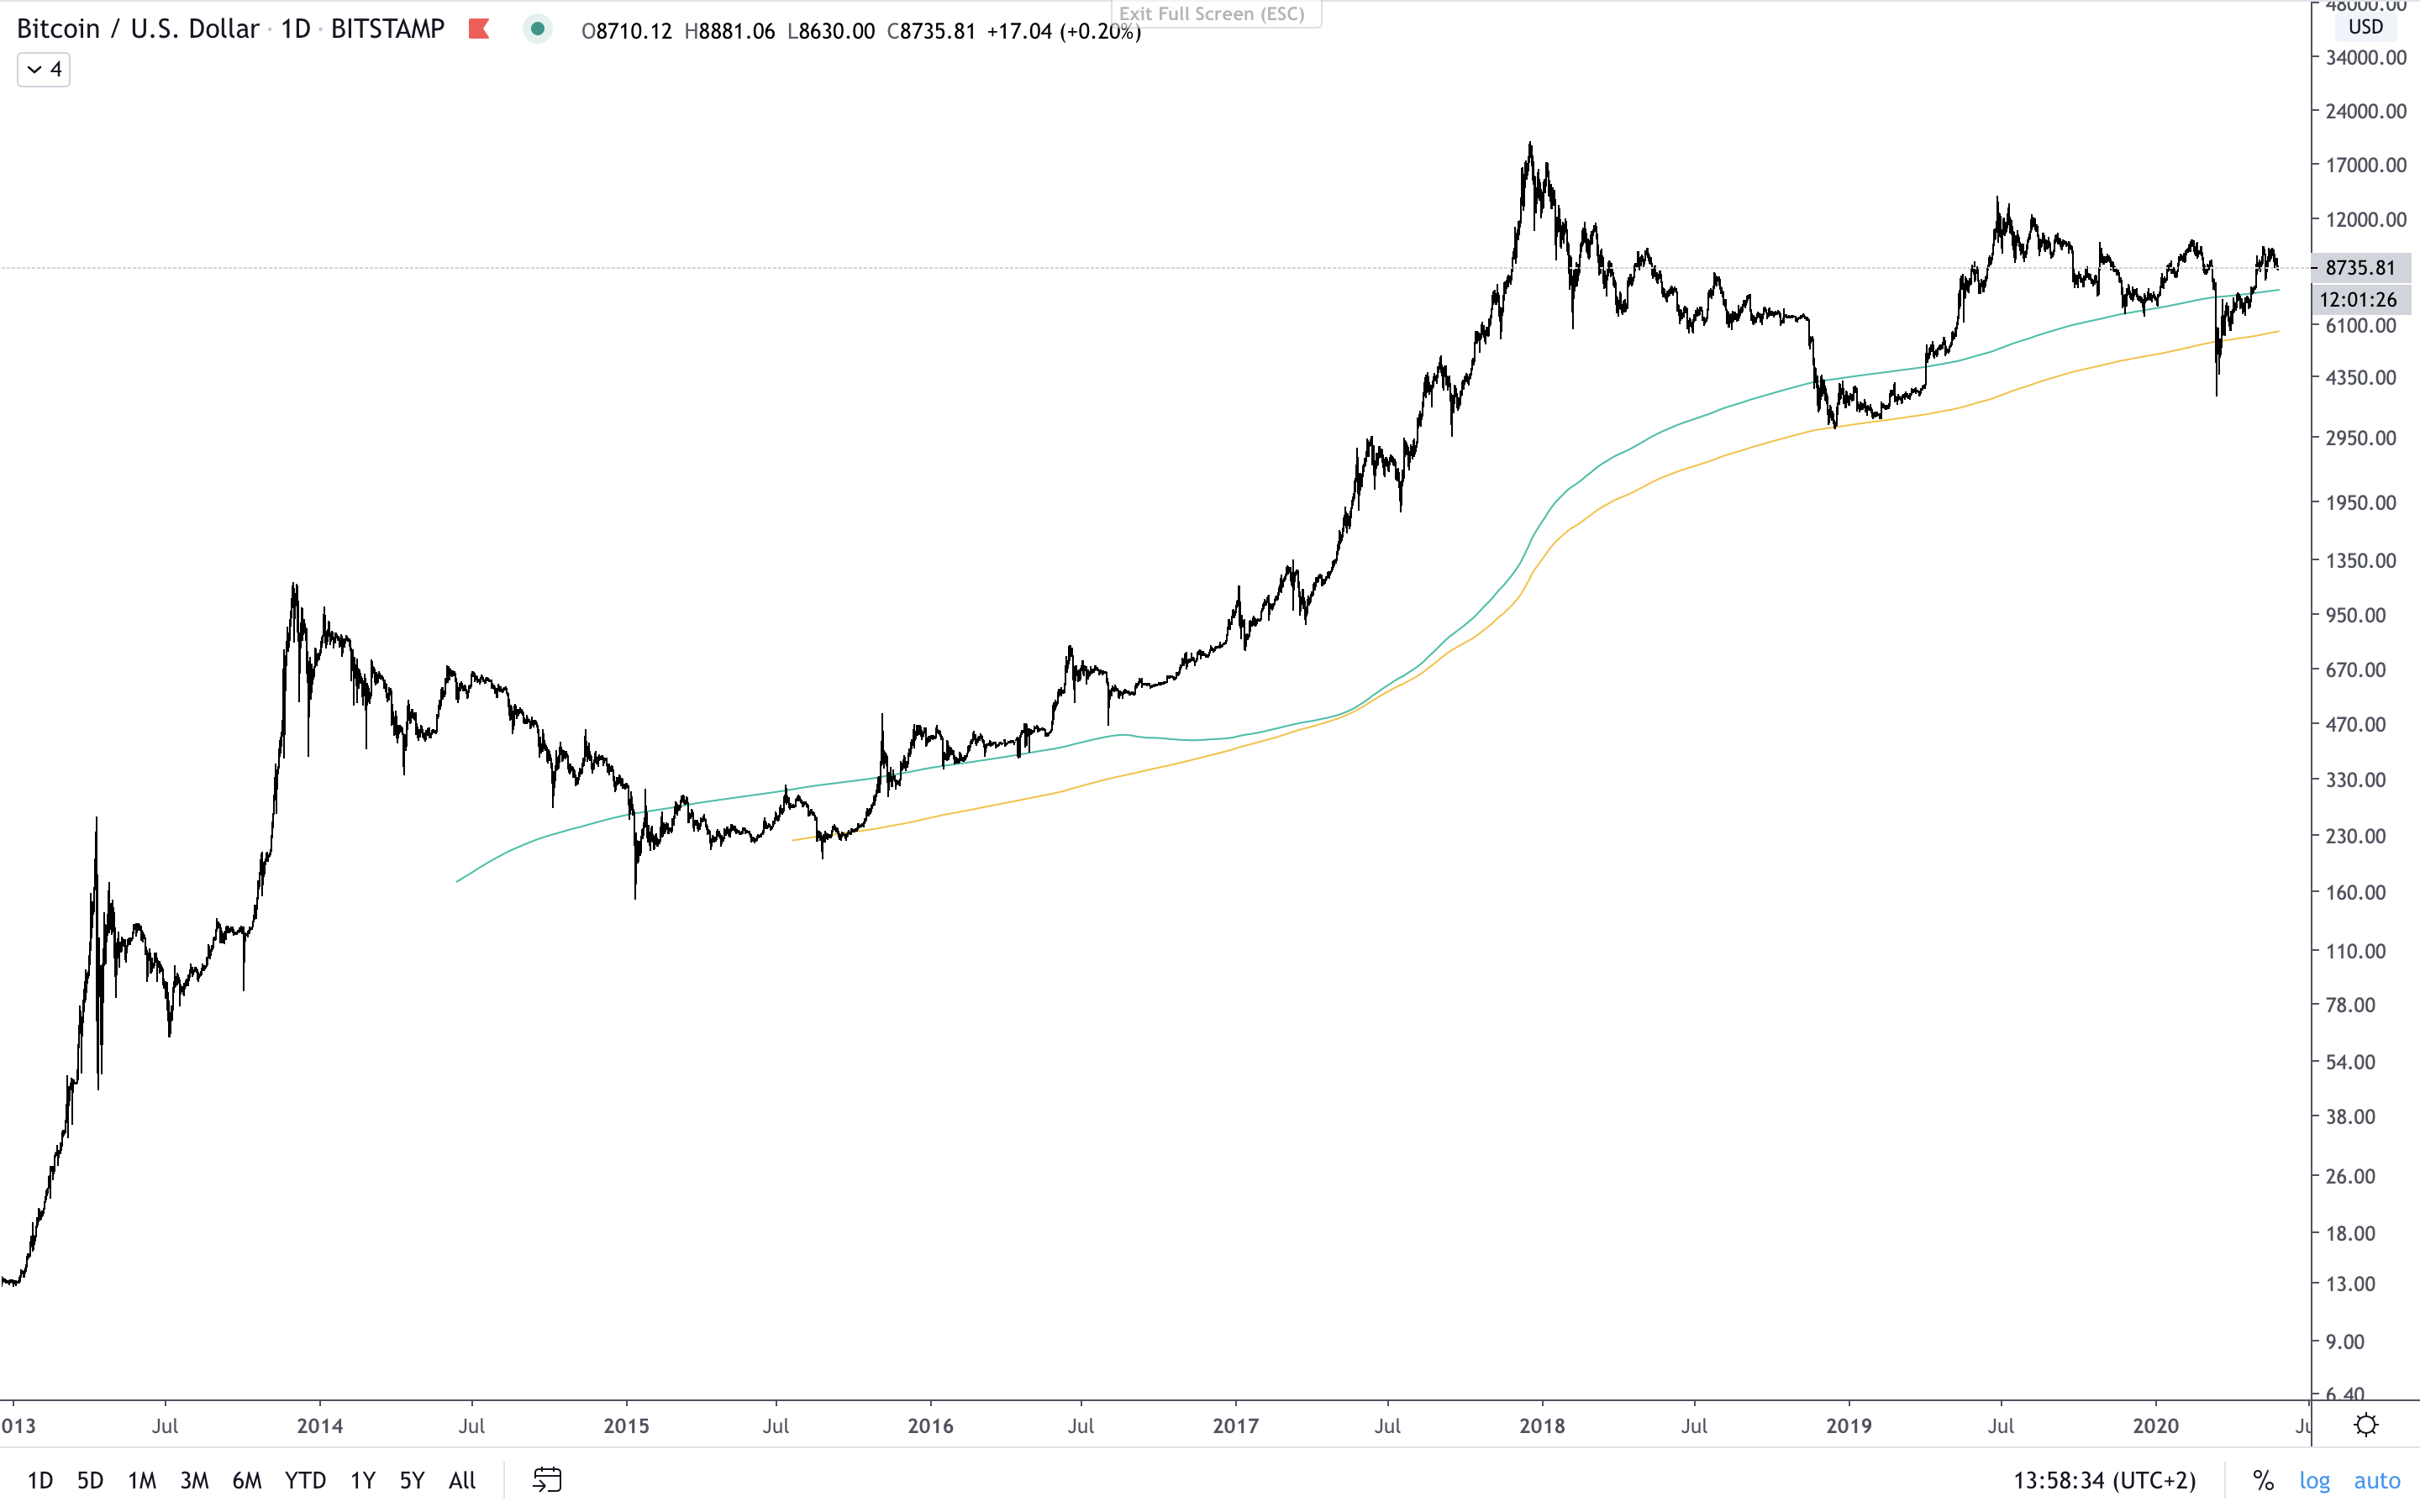 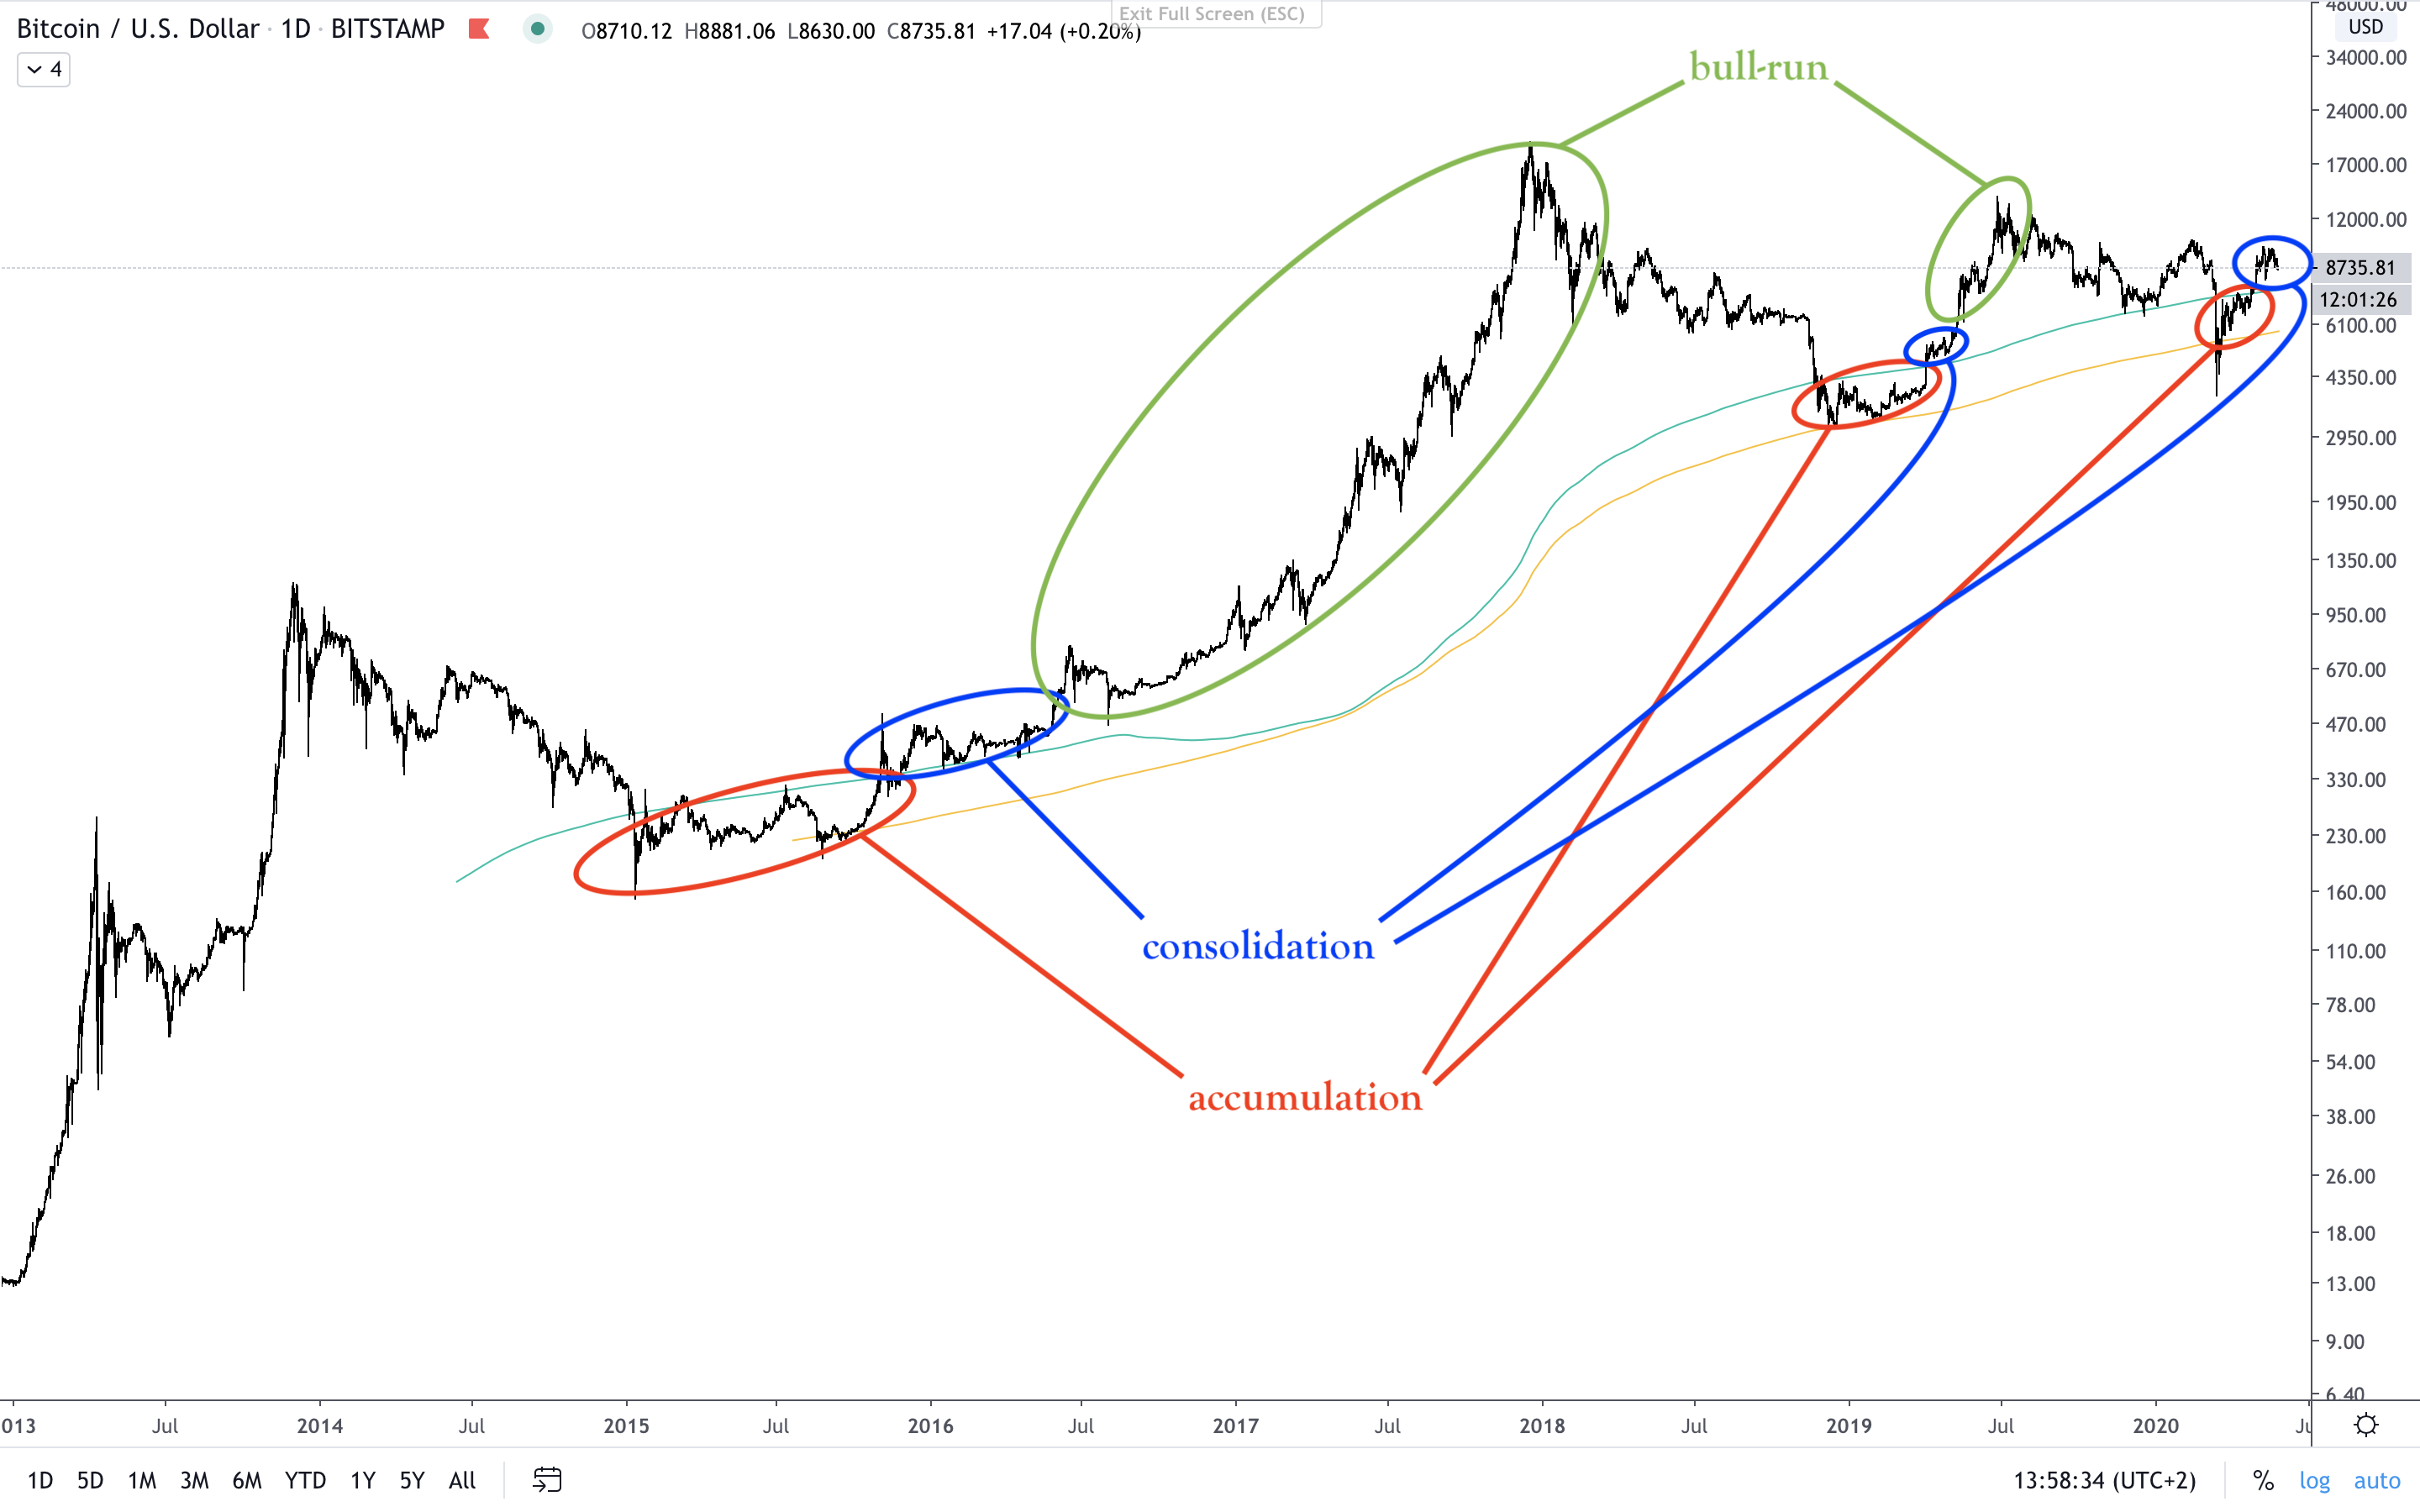 This picture is something I owe to an other analyst who gave me the idea. what's interesting is that when you draw *MA 1000 & 1400 close* it defines clear zones where it was a good time to buy and accumulate bitcoins. Usually when the price took off from those zones it consolidated right above it, just before a new bull-run. And we just left this specific zone and are now consolidating right above it. **We should logically now expect a new bull-run according to that theory**. **Weekly exponential cycles** 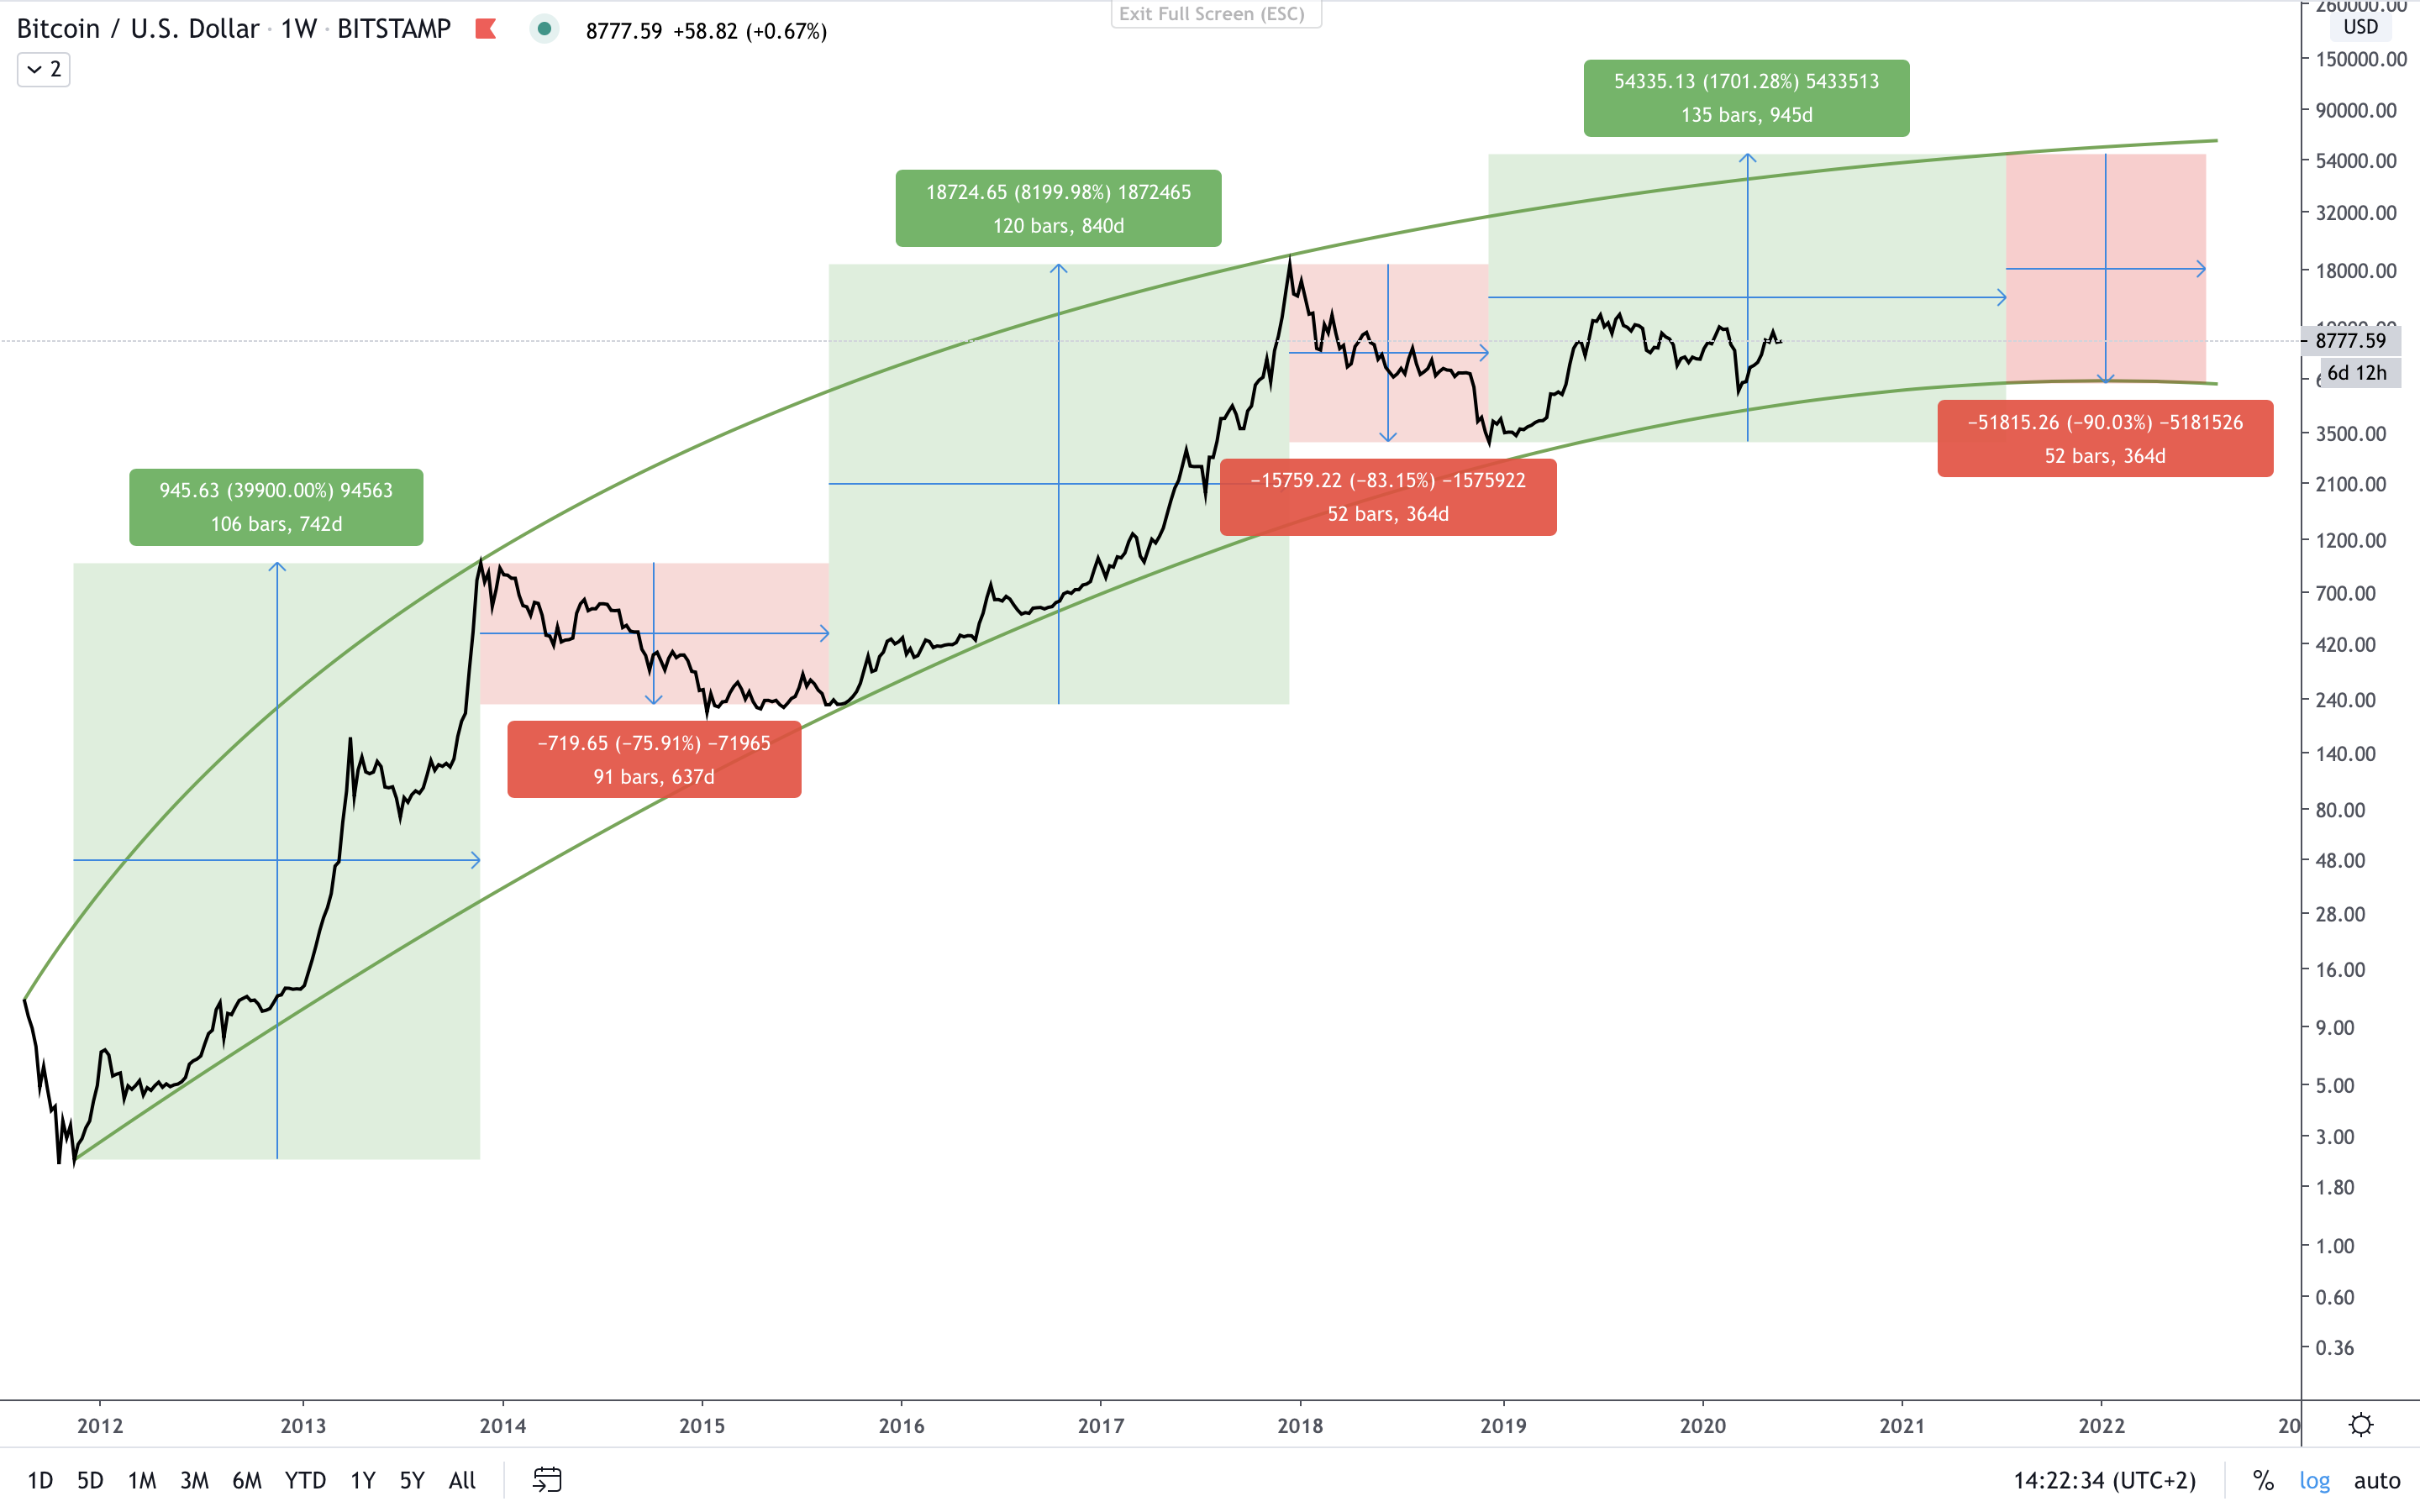 This is a very well known picture that has been re-interpreted thousands of times. I tried here to draw it with proportions consistent with pas trends. According to that picture and the calculations behind it, **we should expect a new all time high around 55'000$/BTC by July 2021**. Then the downtrend following should be even steeper than the ones before with a total loss of -90% in about 52 weeks. **Weekly Gann Fan** 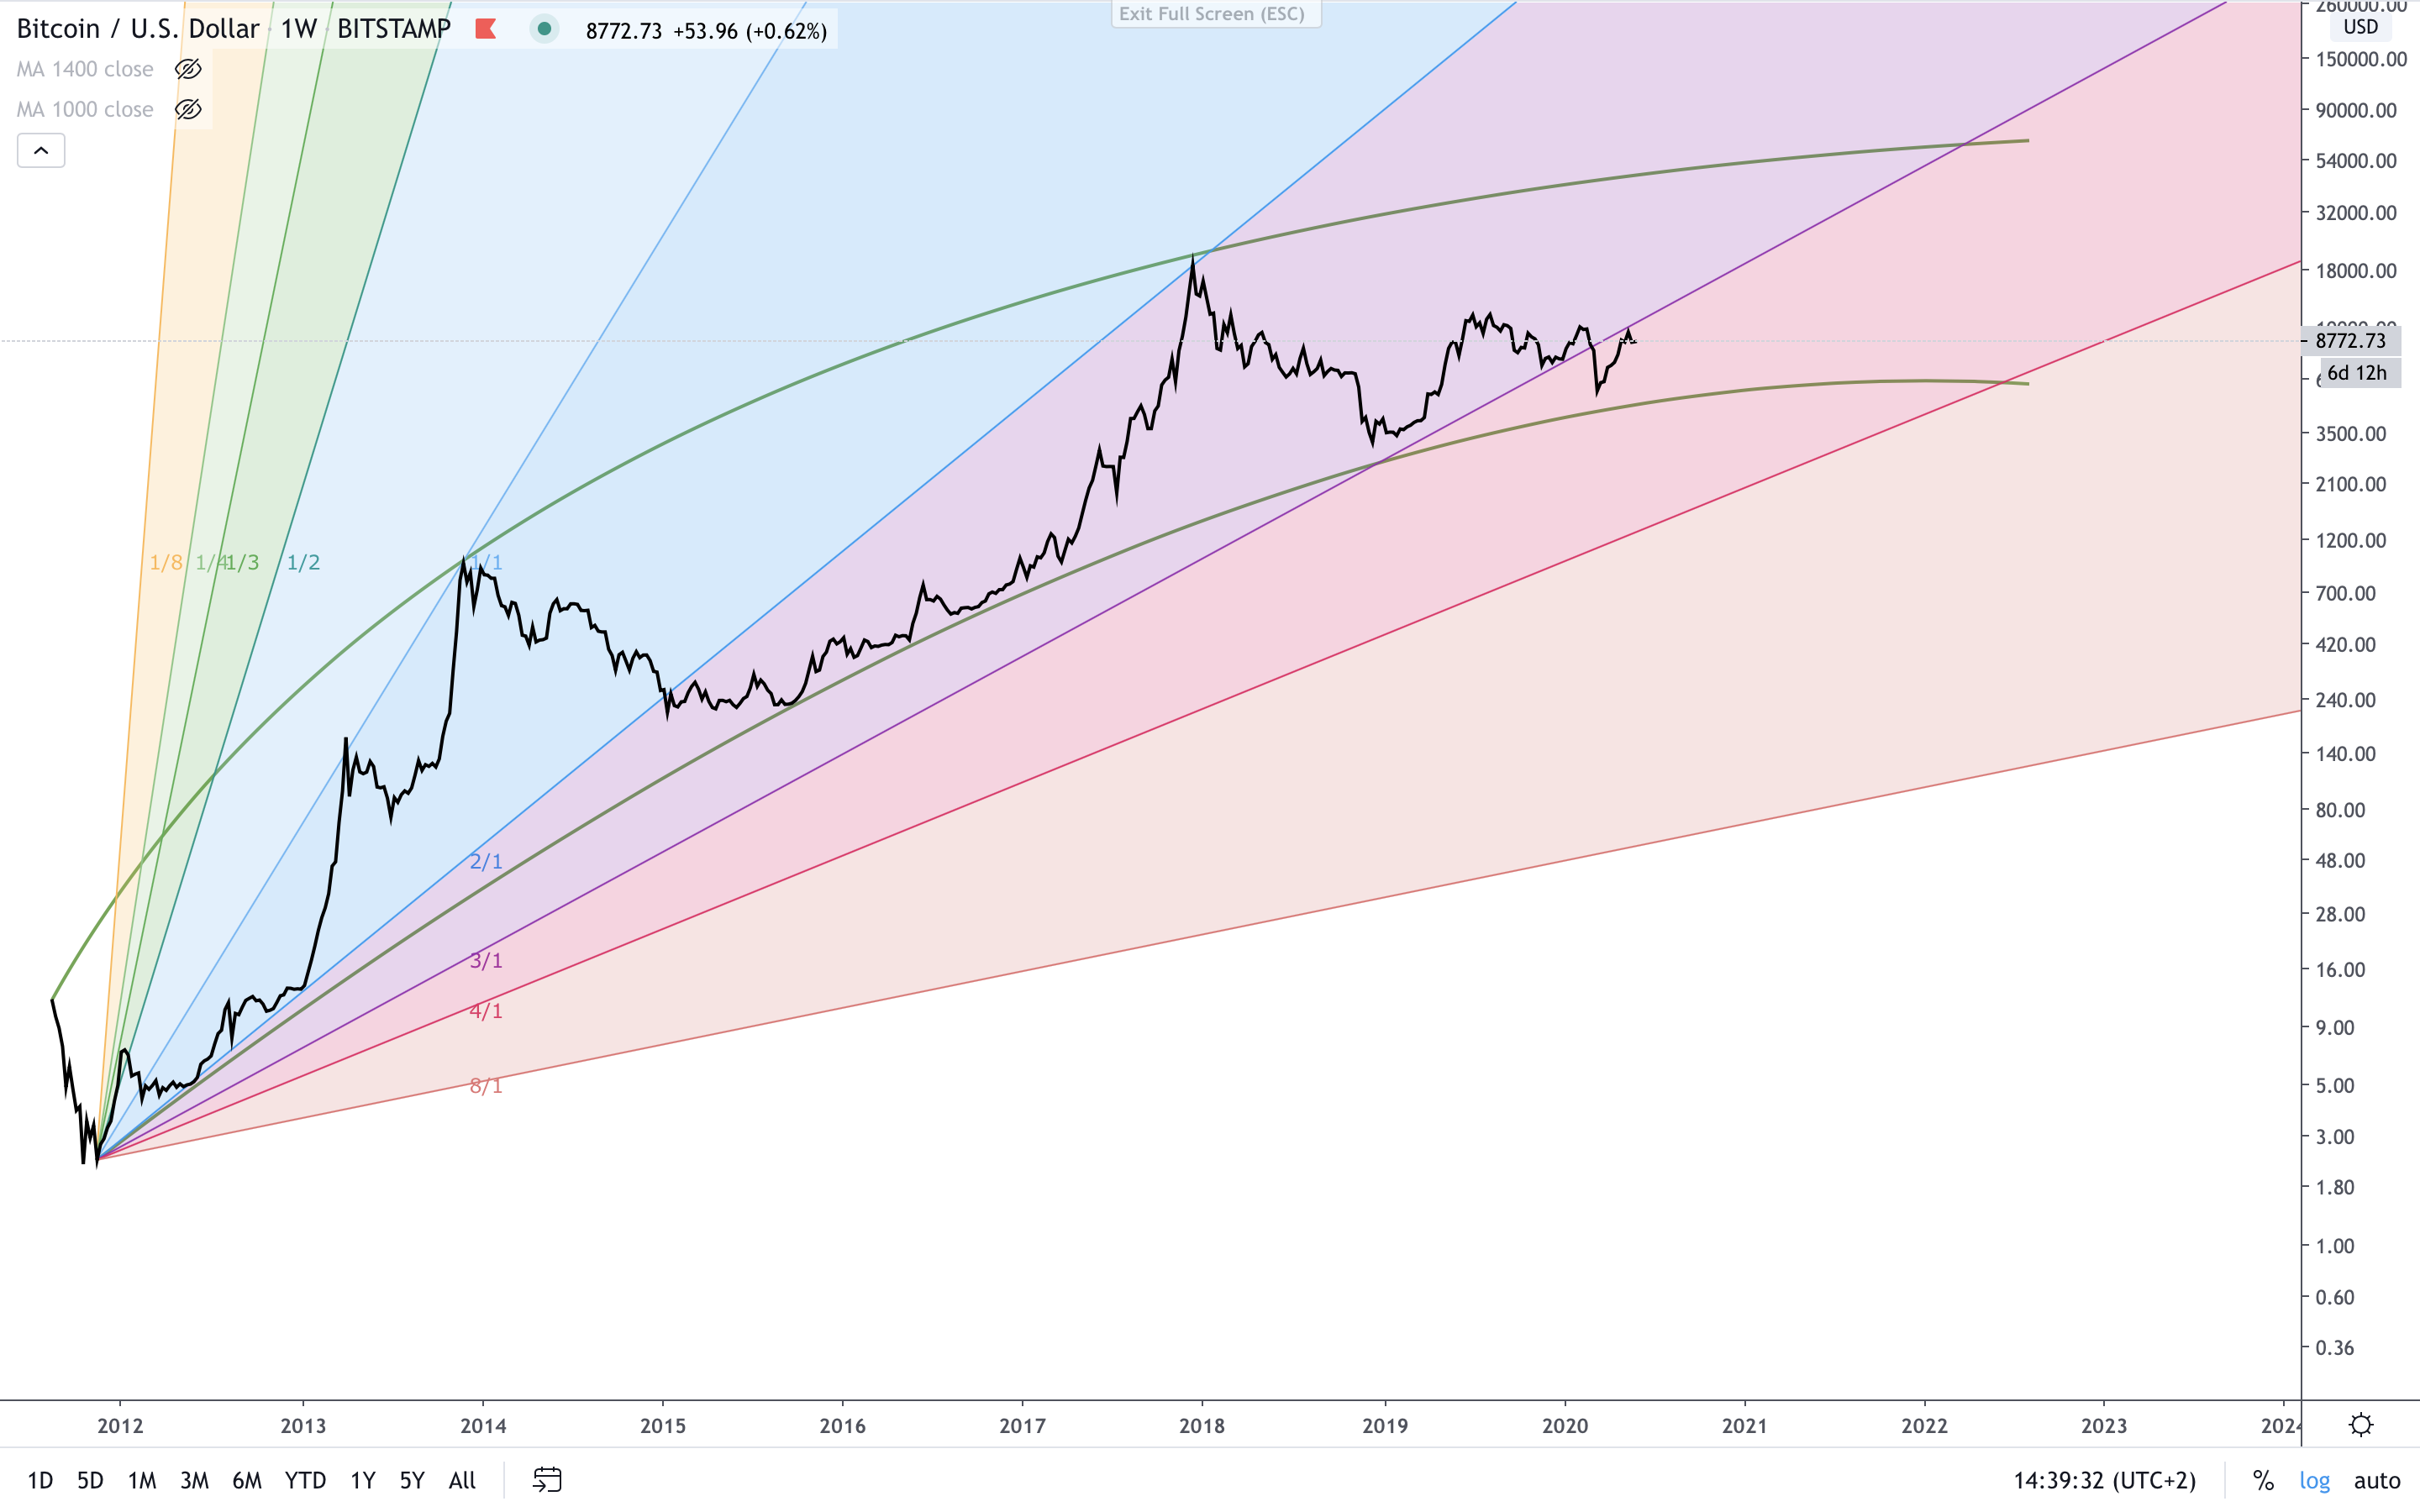 Now looking at Gann Fan, if we try to compare the actual movement with the old ones we can see that price made all time highs just under the rays at the crossing between the ray and the exponential line. If we try to extend the theory to the actual movement, **this bring a new all time high around 63'000$/BTC by March 2022 with some possible new lows around 5'000-5'500$/BTC on the road before the final bull-run**. Those last two theories aren't contradictory but show different timelines and this is the reason why I decided to talk about those two. On the long term they're both bullish, but they somehow both show the possibility of some short downward trends before it happens. Now I'll try to stick to the actual technical analysis before giving any conclusion. ### Weekly TA **Technical drawings** 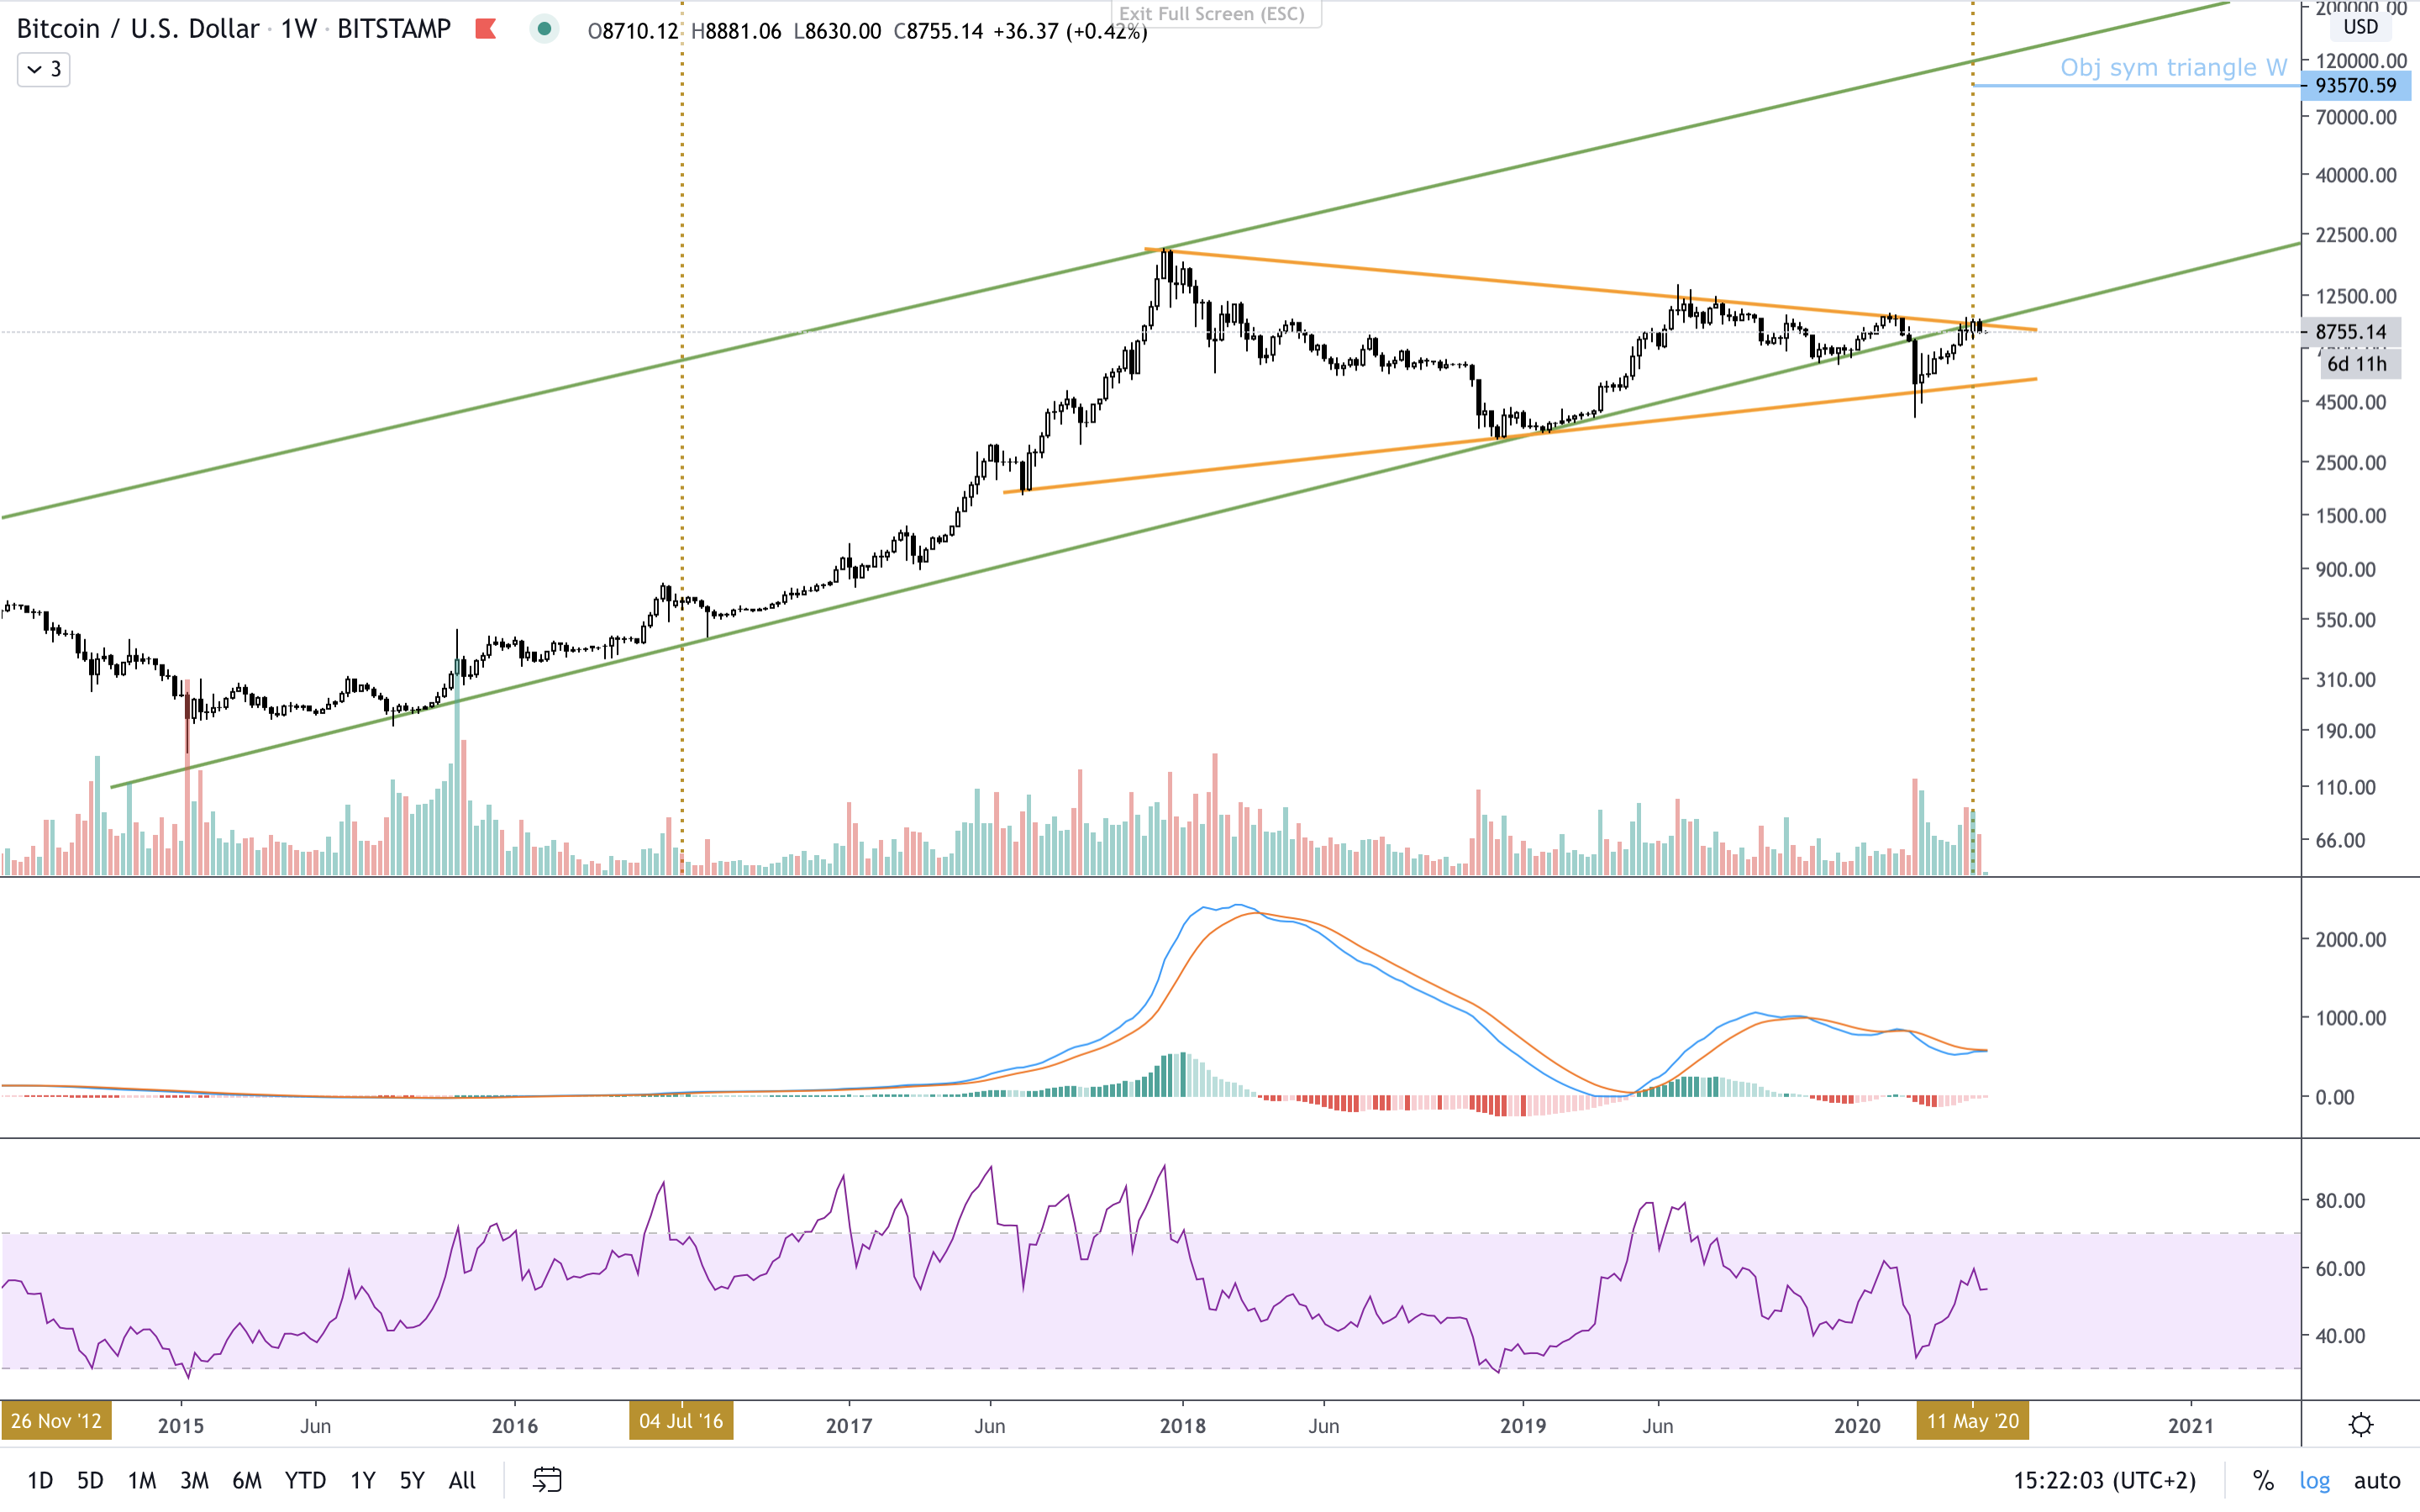 On the weekly TU the price formed a symmetrical angle whose objective stands around 93'000$. However it looks like the price may be stuck under the long term parallel channel. MACD is however turning positive during the last week which could turn into favour of a new bull-run out of the symmetrical angle. **Exponential moving averages** 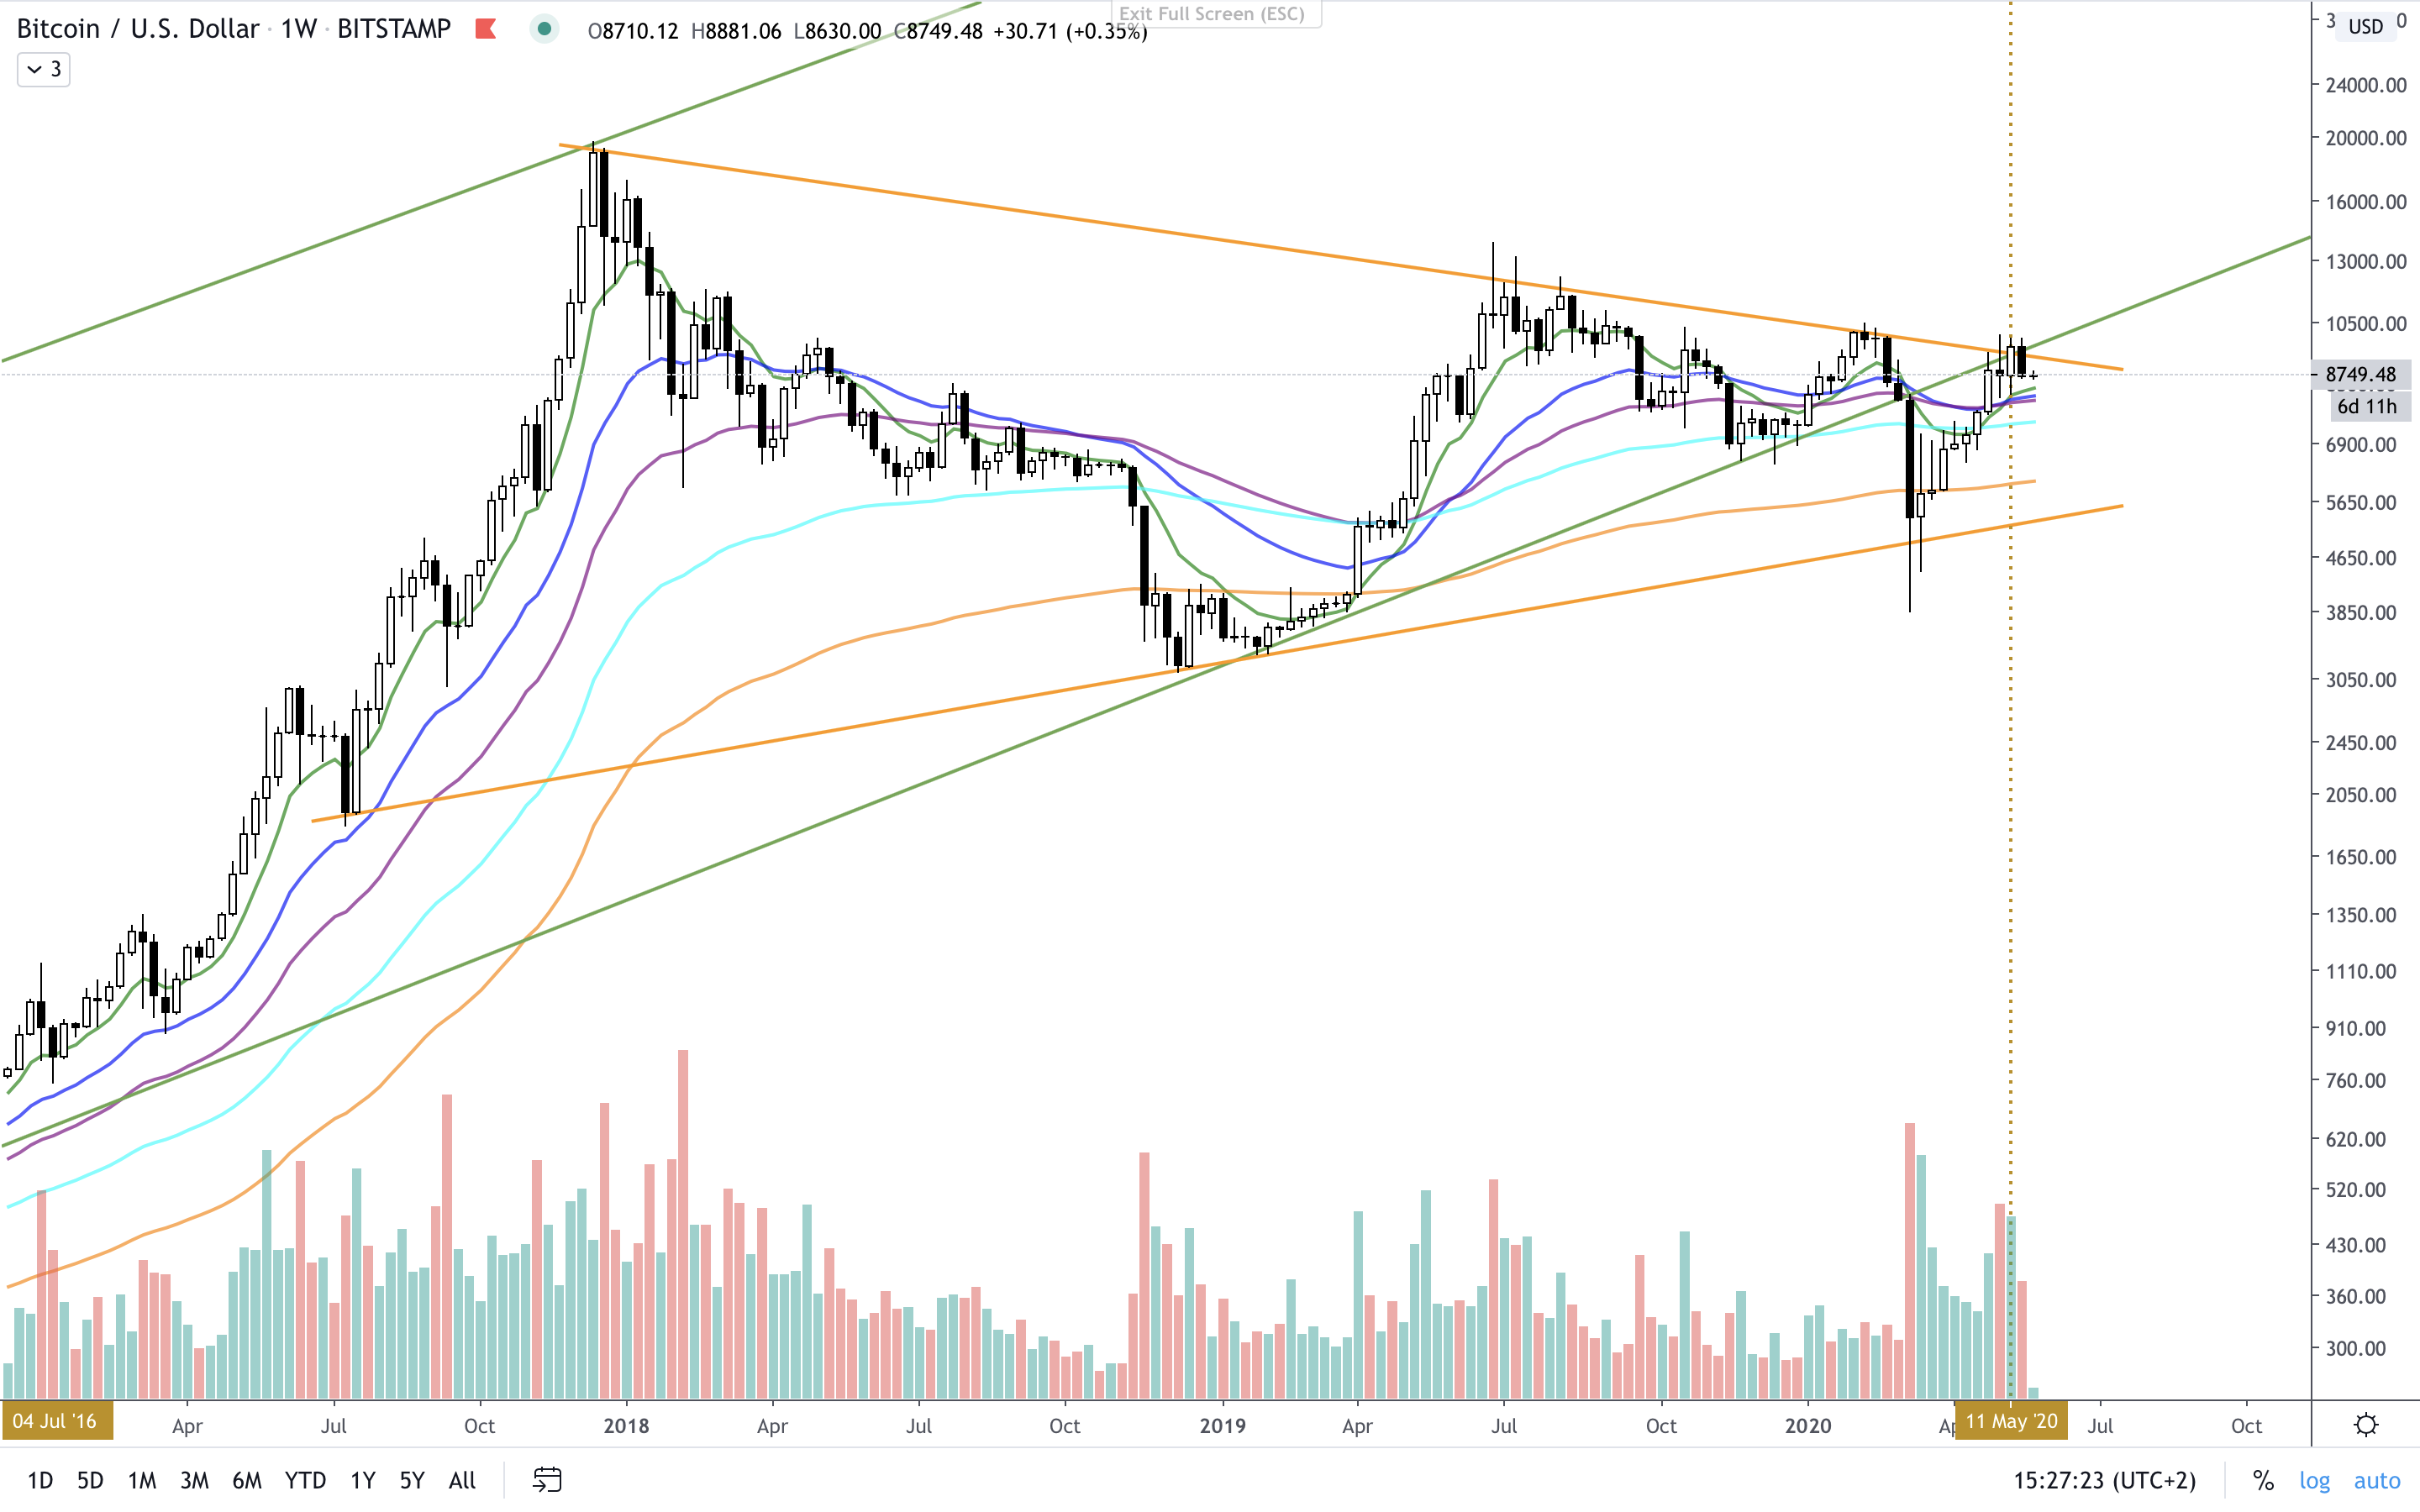 On EMAs' side, uptrends entries are always marked by the price crossing EMAs 26 and 50 and by EMA 26 evolving above 50. This position is now confirmed and as long as it stays that way the chart remains bullish. However I'd keep a close eyes to those two... 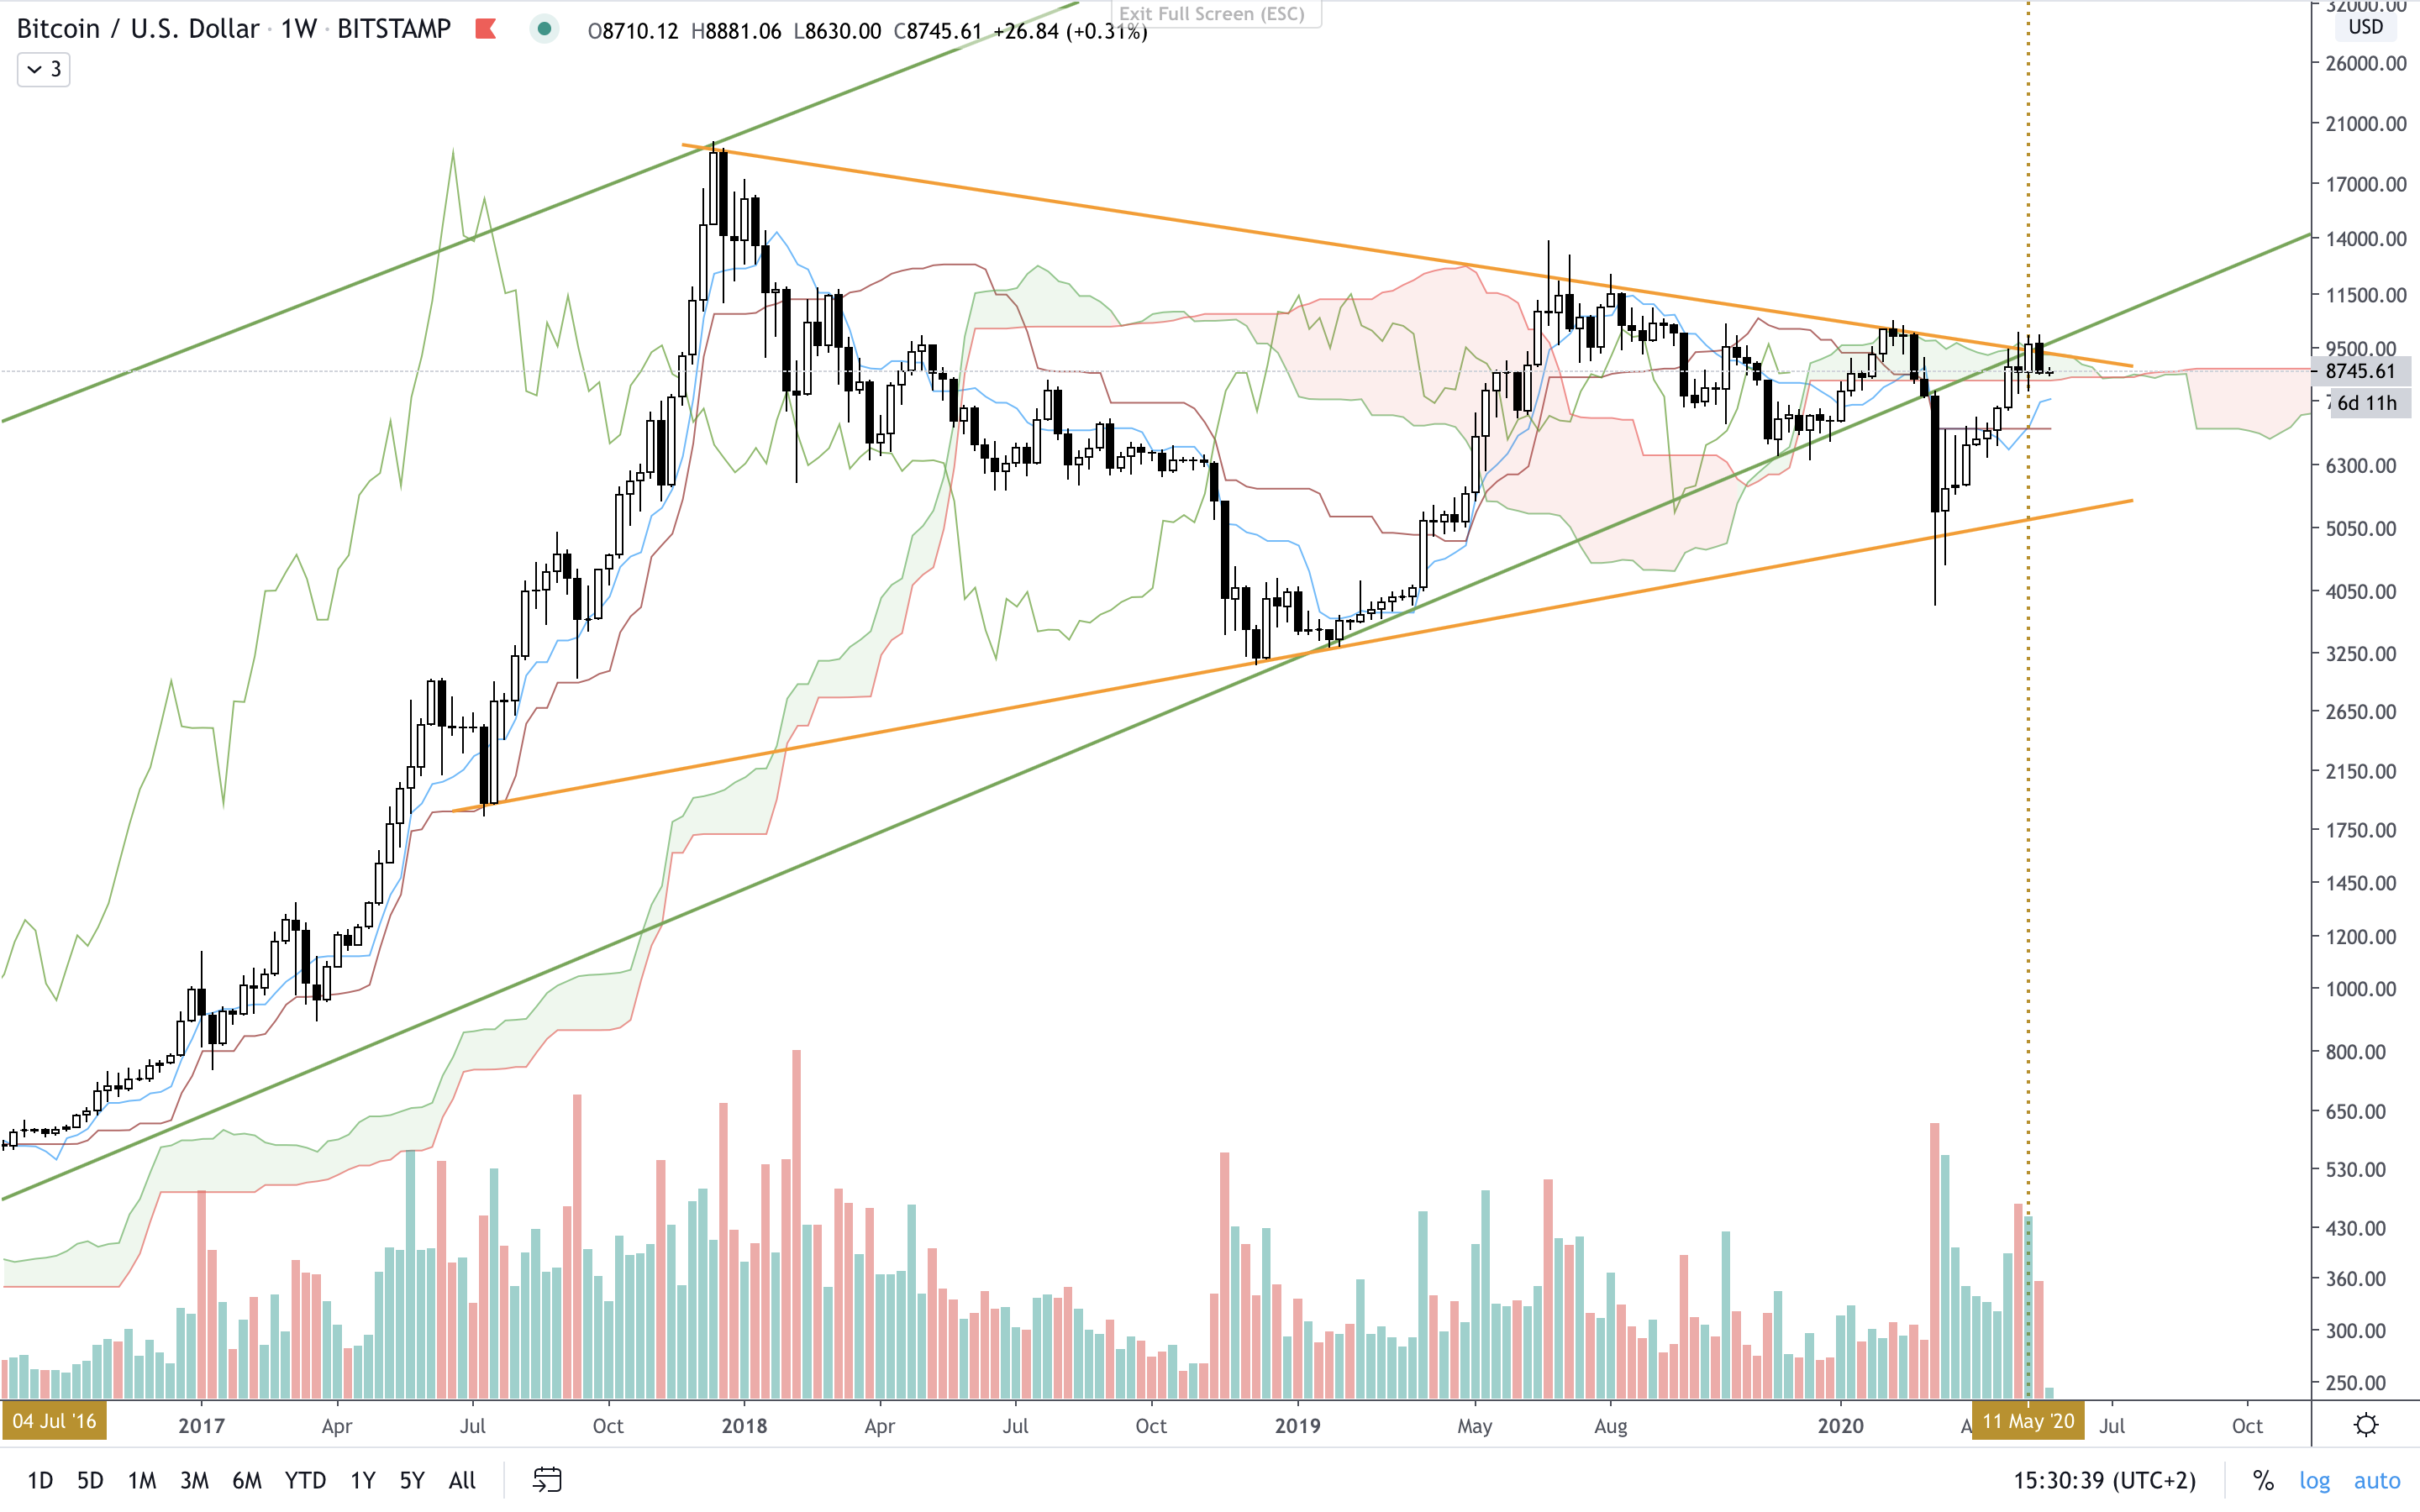 **Ichimoku Kinko Hyo** On Ichimoku's side things look somewhat good too with the price that just broke above SSB weekly and is at this very moment retesting this level. But as long as the price remains in the cloud the trend remains uncertain. Which means it cannot for now confirm or infirm an angle bullish breakout. ### Daily TA **Technical drawings** 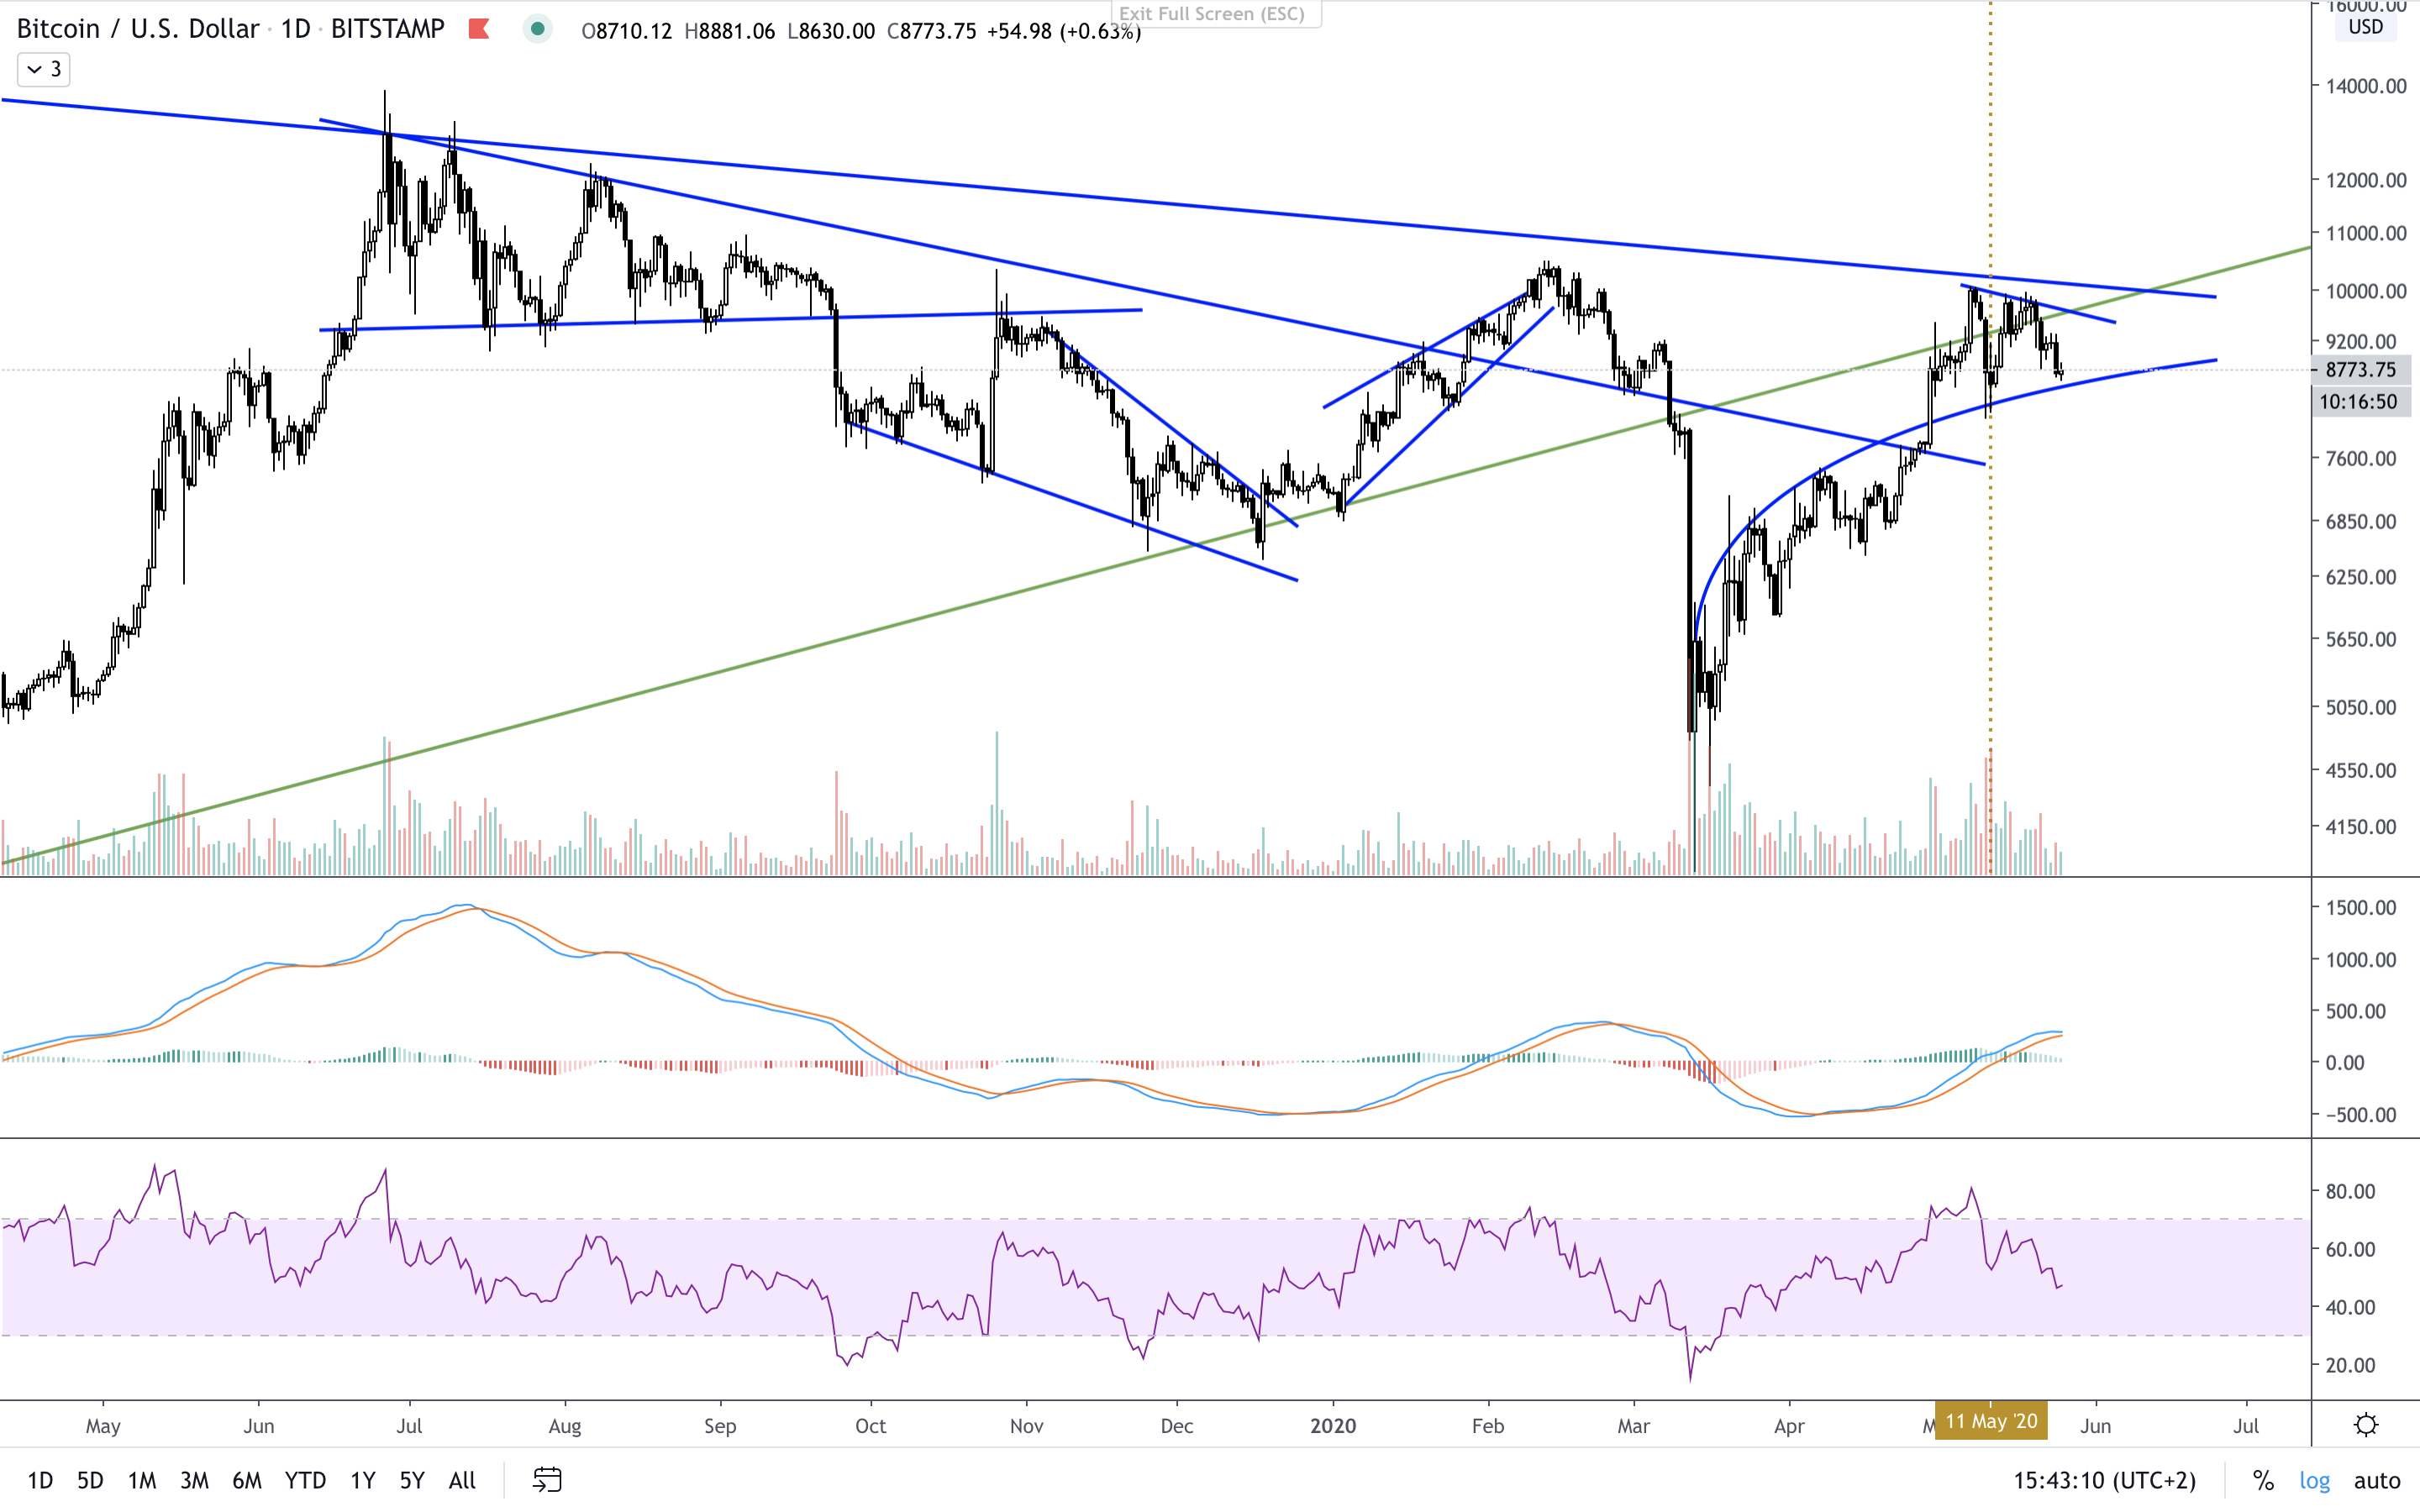 Even if on the short term it climbed above the resistances, it failed again to cross over the long term one corresponding to the weekly symmetrical angle. And also there's this BTC daily ladder that talks : 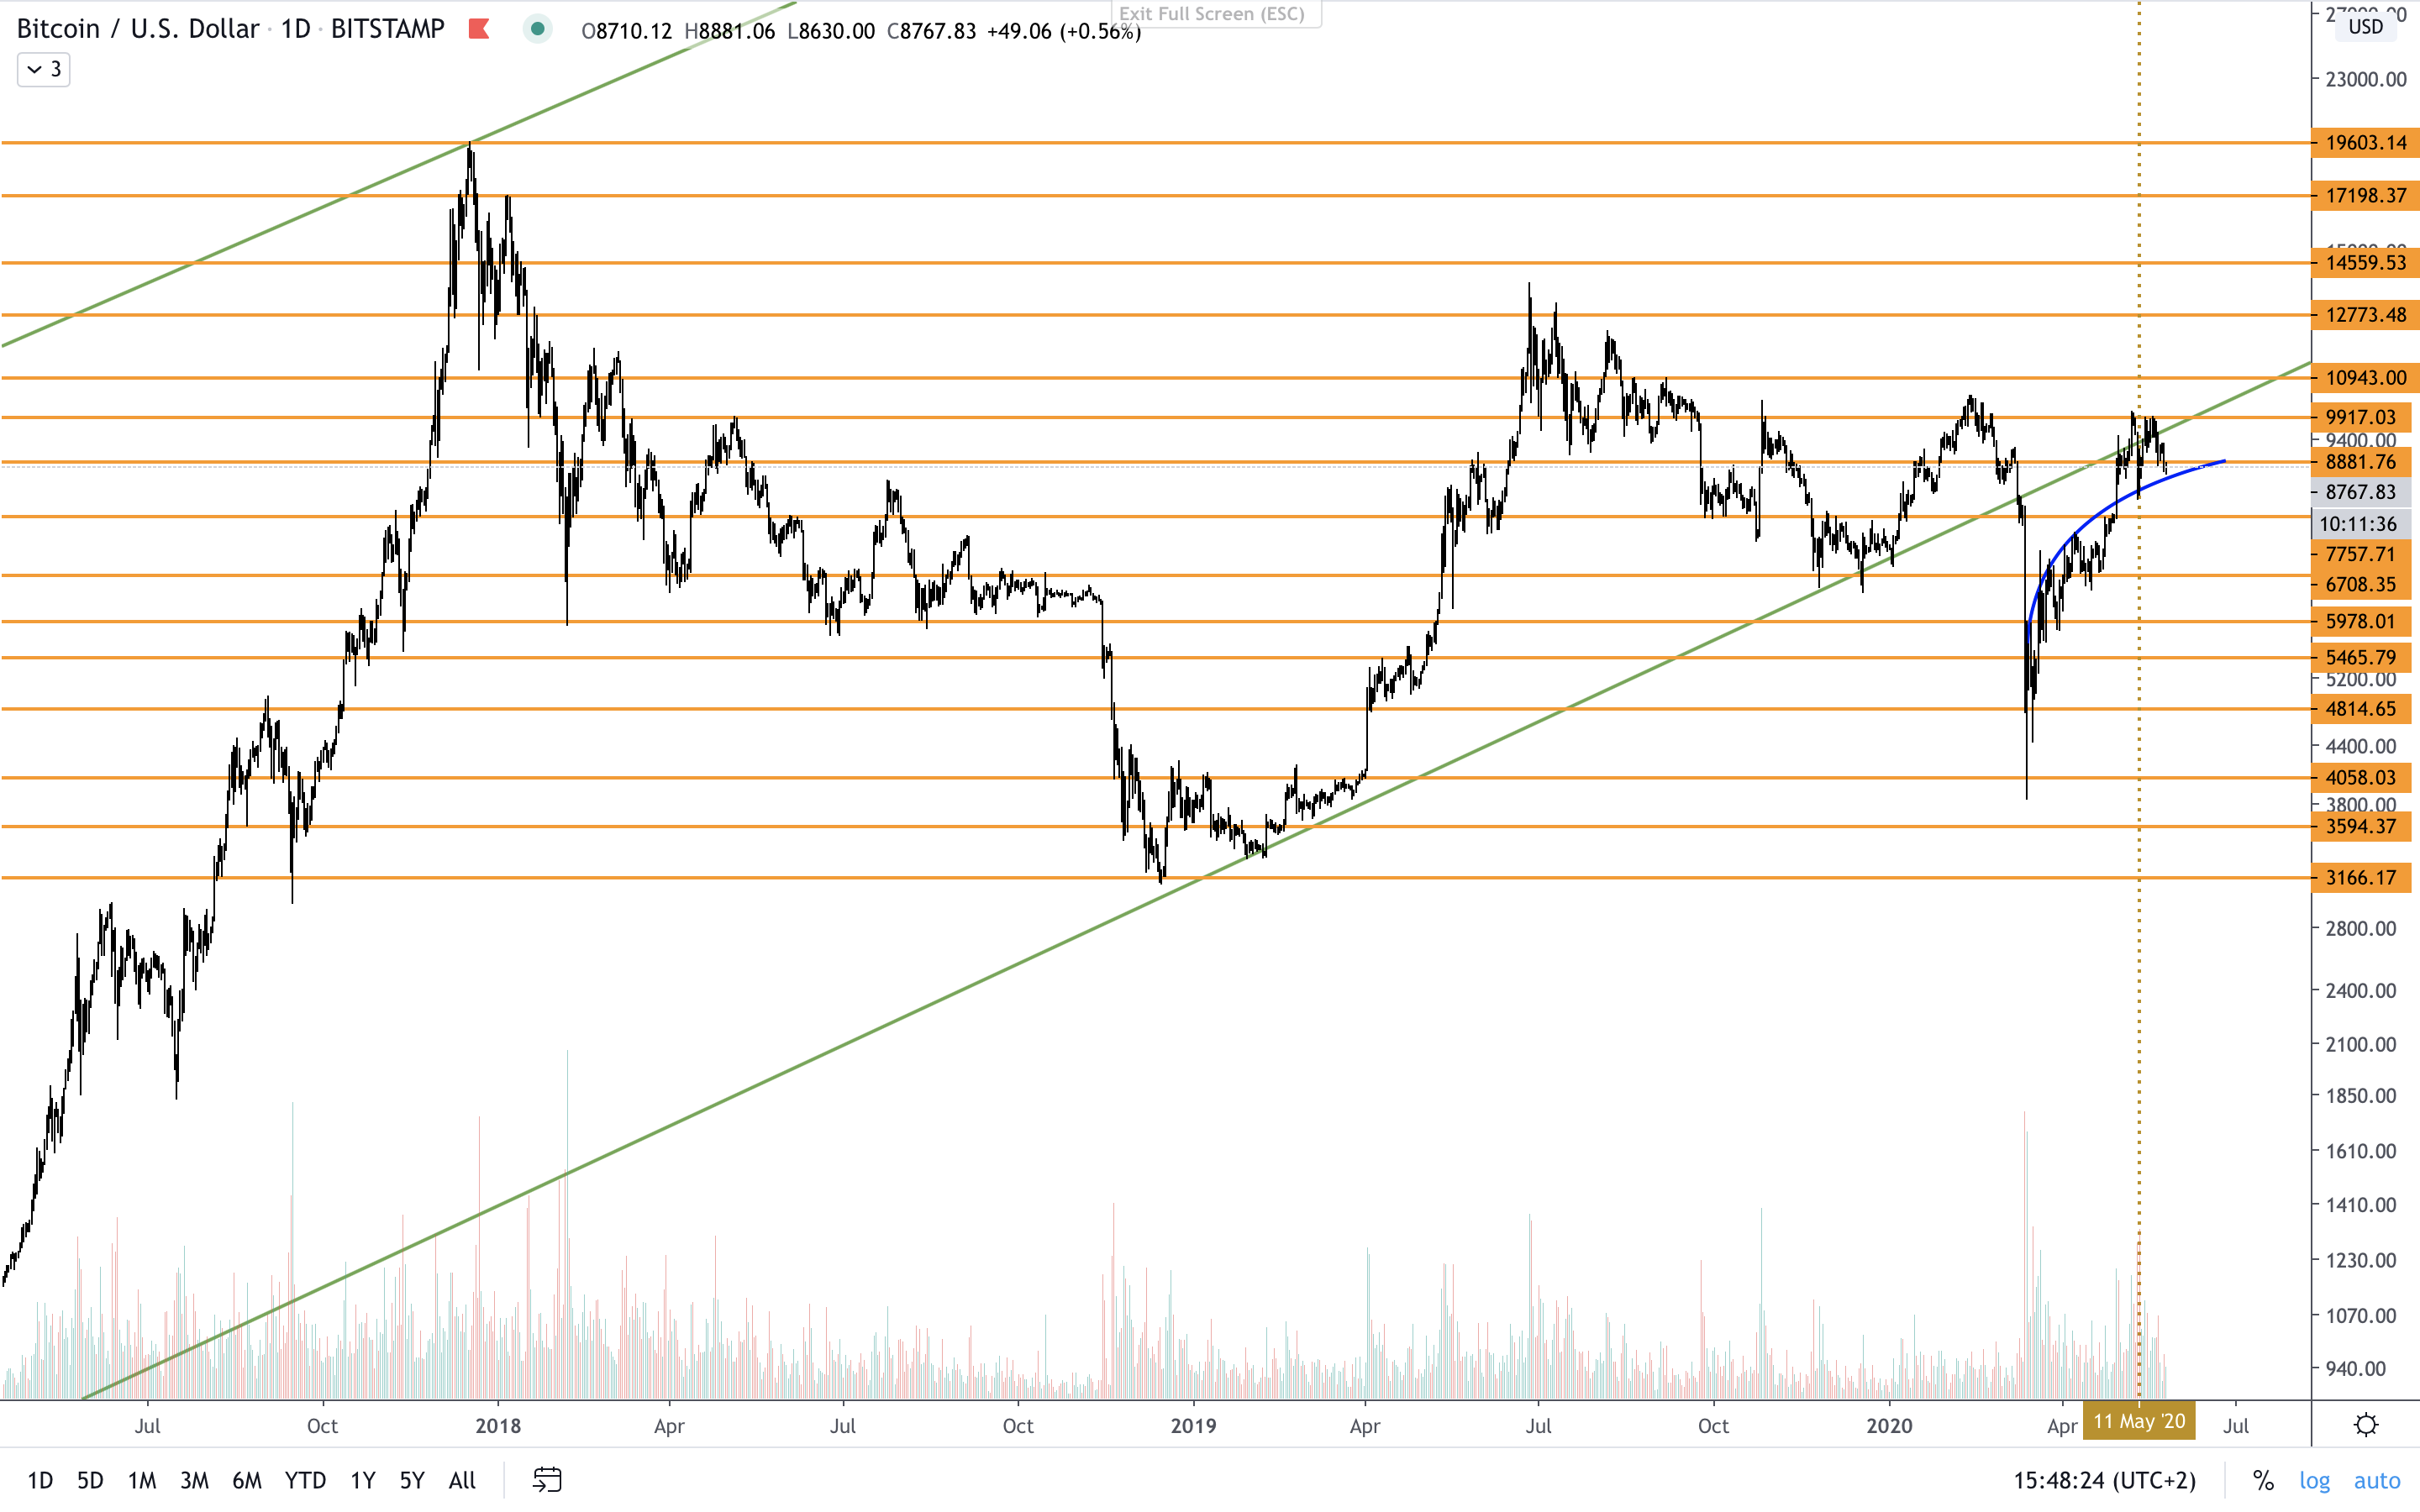 In here price failed now for the third time to rise and stay above 9'900$ level. If it crosses under the exponential line (blue line) designed during the last weeks then I would consider a short term sell off. **Exponential moving averages** 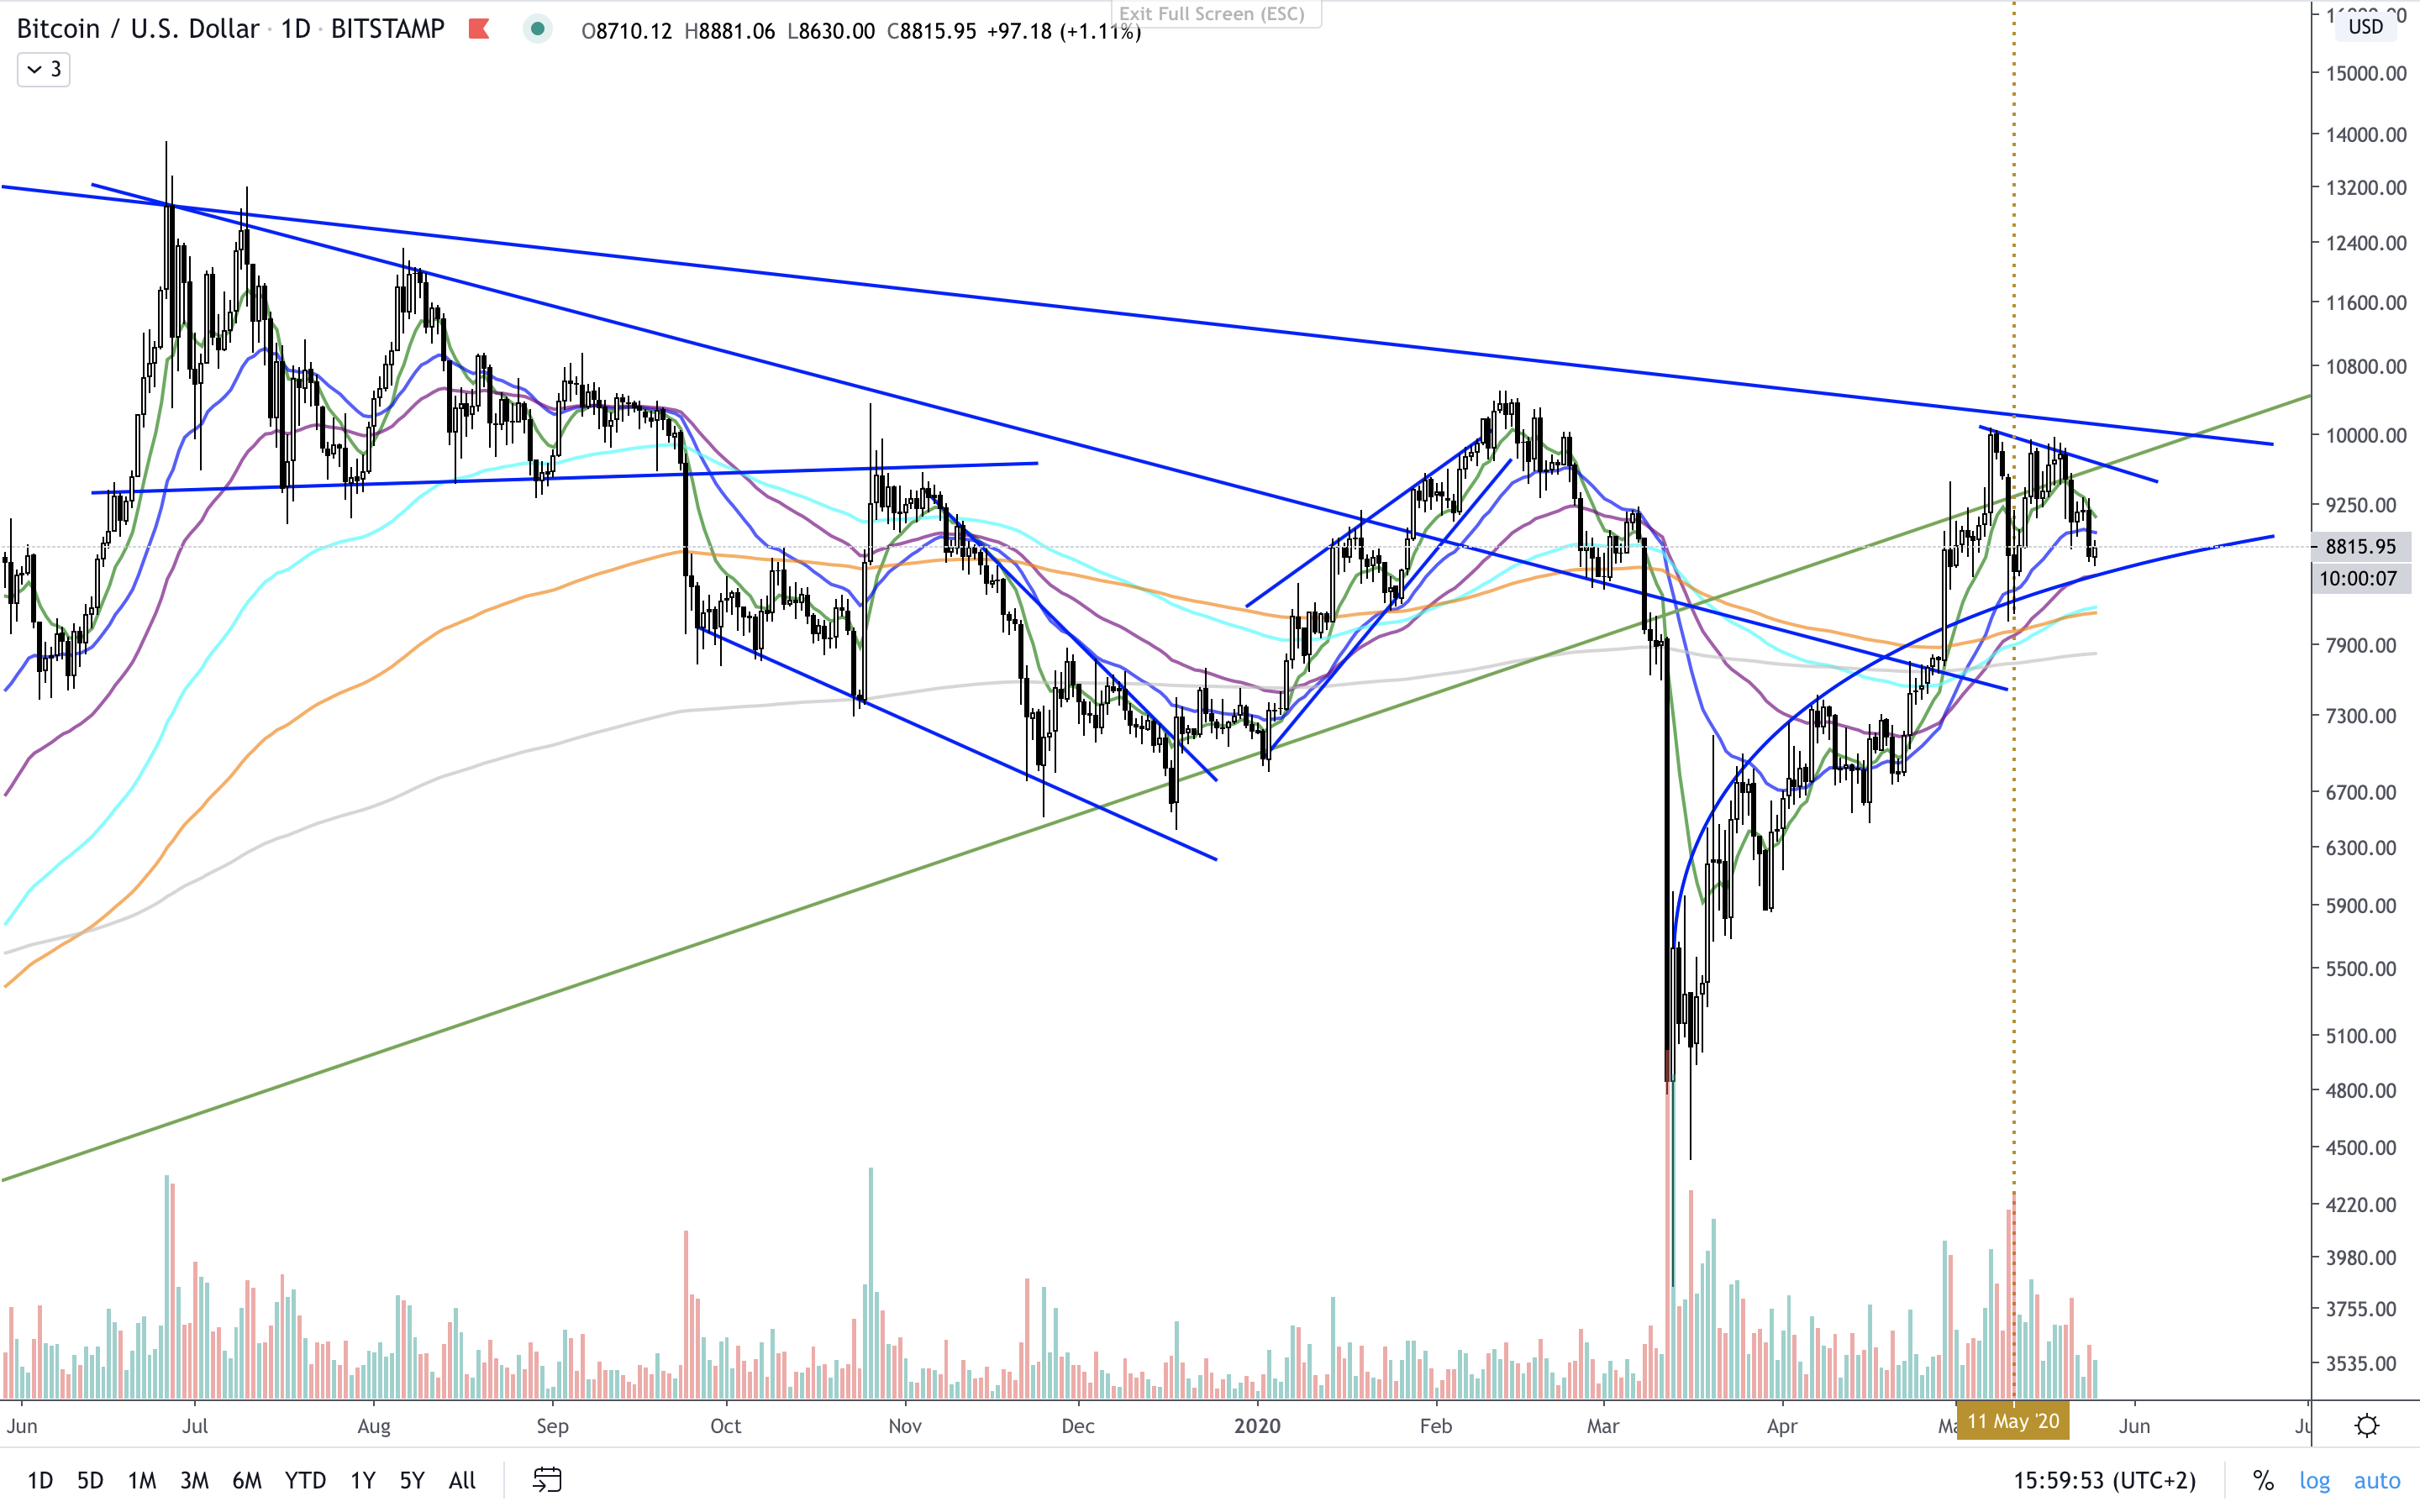 Regarding EMAs 26 and 50 again we just received an alert signal with price crossing under EMA 26. If it crosses EMA 50 it will cancel the upward trend and if EMA 26 crosses under EMA 50 this would confirm a downtrend. So I'd keep a close eye on the daily TU because of this also. **Ichimoku Kinko Hyo** 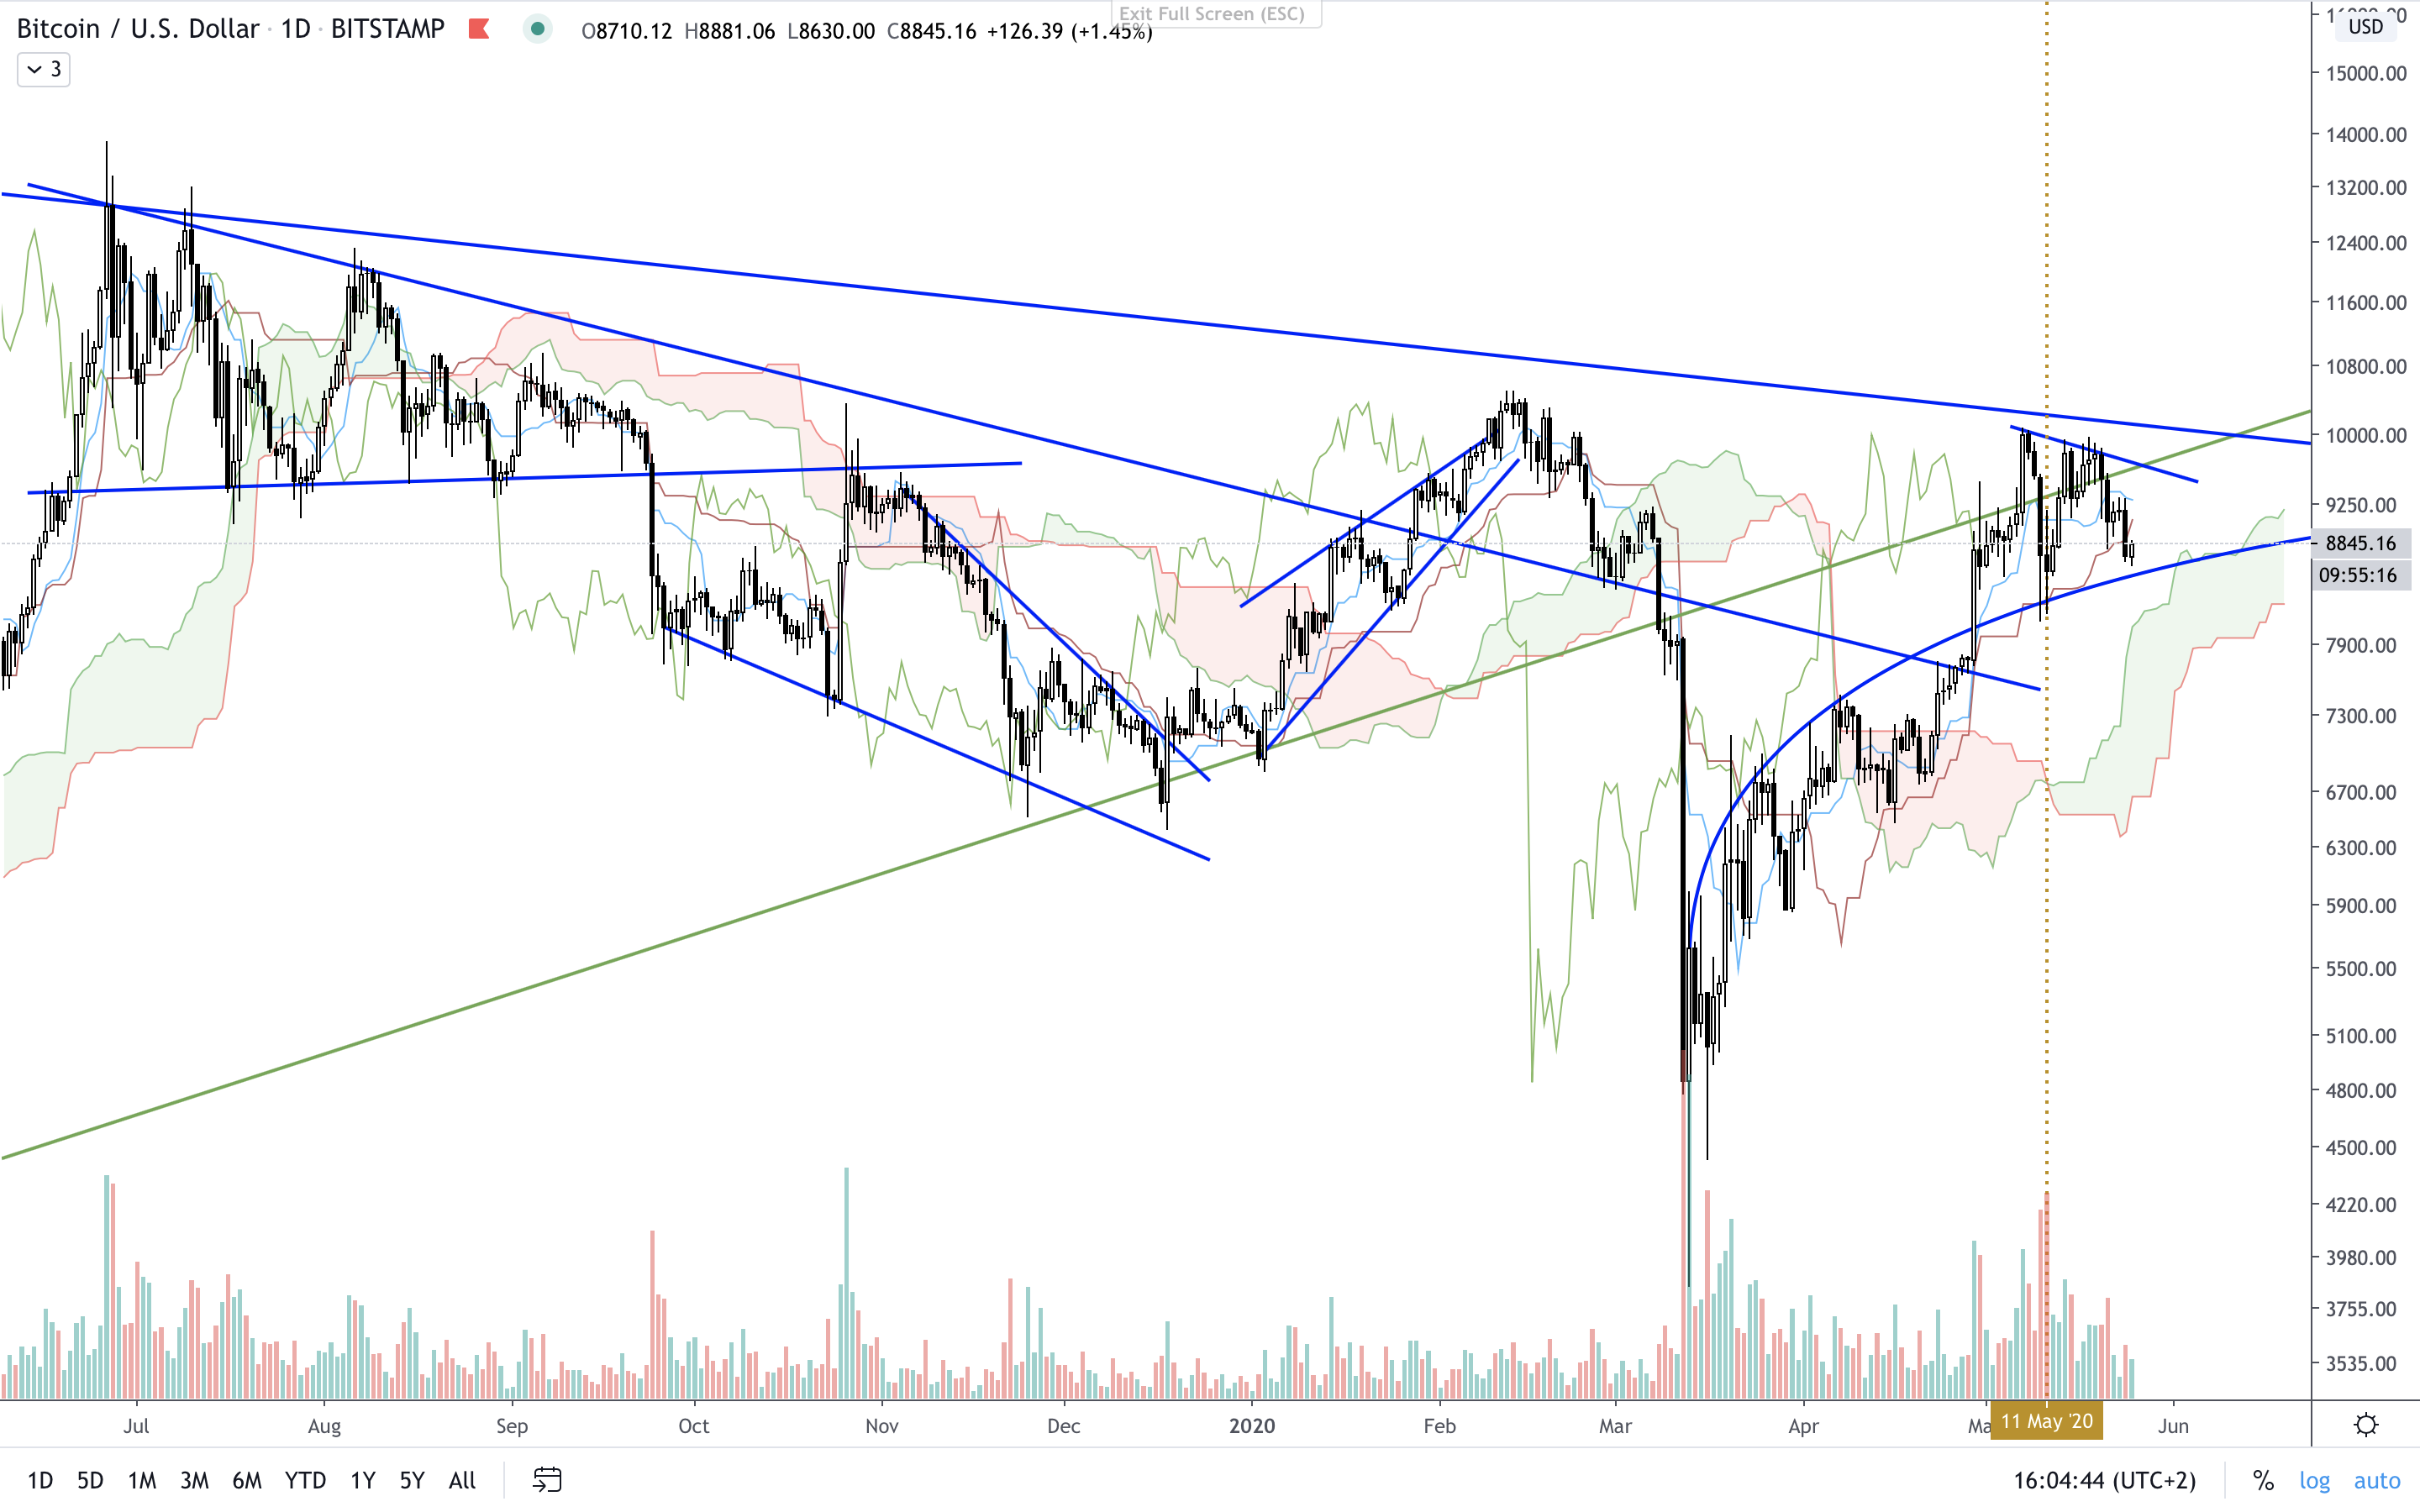 On Ichimoku's side price is still above the cloud but recently went under the Kijun Span. This is sign usually admitted as bearish. Although each time it happened in the last month it was to initiate a decline. ### Conclusion - Long term cycles : even if they're all bullish on the long term, neither of them infirm the possibility of a pull-back to the 5'500$ region before the real bull-run begins. - Middle/long term : trend is totally uncertain and trying to figure out if we will break up that weekly symmetrical angle or push back to the 5'500$ level. - Short term : if we rack up all the signals (downtrend resistance, daily ladder down-crossing, EMA 26 & Kijun crossing) we may have begun a short term downtrend. -- - **Overall conclusion** : I think in the long term we have a very nice bull-run awaiting and slowly getting prepared. However, this long term trend isn't protected from other lows in the way, lows that shouldn't get under 5'500 or max 5'000$/BTC. The price evolving in uncertainty in the weekly and the daily TU tells us we may very well come to one new low in the next days/weeks. Just to take the most of this long term I will stop playing with the shorter terms (4h or even 1h) and I will focus on the daily TU for my future trades. - Stop loss : daily price closing under EMA 50 and under the exponential trend line (around 8'500$) followed by a new buy as soon as the price comes to the 5'500$ level (or re-evaluation at this level in case of new signs appearing) - Buy order : daily price closing above long term trend line (around 10'000$) ___ ### Final word If I had to compare conclusion of this article to [the previous one](https://peakd.com/hive-167922/@blesspatrick/eth-and-btc-pre-halving-update), I would stick to the same position. I am not expecting a strong uptrend right after the halving that happened to be on the 11th of May 2020. I am still watching closely the market as it may come to a new low in the next weeks or even days perhaps. My goal now is to play safe in the next days not to lose money but to be prepared to take advantages of a new low entry door. And if it doesn't come then I'll buy at the weekly symmetrical angle break out. ___ Next article in line to be published : - ETH/USD - Ethereum new complete analysis - Immediate post-halving time > Stay updated threw the different channels : - [Telegram channel](https://t.me/BlessFinance) - [Twitter](https://twitter.com/FinanceBless) ___ ***Don't hesitate to tip to support my work and help my researches. ETH address :  0x3afdd2FEdd6F2DA6Bb7EB8fc5F901eC12dE8B239*** ***BTC address :  1MfeTDWqSEY3L9PPSw9iF6dtA1bN9HvSSo*** ***BAT address :  0x3afdd2FEdd6F2DA6Bb7EB8fc5F901eC12dE8B239***
| author | blesspatrick |
|---|---|
| permlink | btc-usd-bitcoin-new-complete-analysis-immediate-post-halving-time |
| category | hive-167922 |
| json_metadata | "{"app":"peakd/2020.05.5","format":"markdown","description":"BTC long analysis based on long term trends and technical informations (TA, Ichimoku, Gann, Fibonacci, EMAs)","tags":["leofinance","blessfinance","investment","bitcoin","ethereum","halving","portfolio"],"users":["blesspatrick"],"links":["/hive-167922/@blesspatrick/eth-and-btc-pre-halving-update","/hive-167922/@blesspatrick/eth-and-btc-pre-halving-update","https://t.me/BlessFinance","https://twitter.com/FinanceBless"],"image":["https://files.peakd.com/file/peakd-hive/blesspatrick/gvnkvTbQ-BTCUSD20-20D20-20MA1400-100020close.png","https://files.peakd.com/file/peakd-hive/blesspatrick/K80T28kl-BTCUSD20-20D20-20MA1400-100020close20analysis.png","https://files.peakd.com/file/peakd-hive/blesspatrick/tDL5z00a-BTCUSD20-20W20-20Cycles.png","https://files.peakd.com/file/peakd-hive/blesspatrick/MyNGwod4-BTCUSD20-20W20-20Gann.png","https://files.peakd.com/file/peakd-hive/blesspatrick/dALvXFWY-BTCUSD20-20W.png","https://files.peakd.com/file/peakd-hive/blesspatrick/fy9448Zg-BTCUSD20-20W20-20EMAs.png","https://files.peakd.com/file/peakd-hive/blesspatrick/sPdh5OIc-BTCUSD20-20W20-20Ichimoku.png","https://files.peakd.com/file/peakd-hive/blesspatrick/wEqF45EC-BTCUSD20-20D.png","https://files.peakd.com/file/peakd-hive/blesspatrick/XvkPnOct-BTCUSD20-20D20-20DailyLadder.png","https://files.peakd.com/file/peakd-hive/blesspatrick/9vBVtNt8-BTCUSD20-20D20-20EMAs.png","https://files.peakd.com/file/peakd-hive/blesspatrick/2HA1LSaF-BTCUSD20-20D20-20Ichimoku.png","https://images.hive.blog/DQmcNoy9zAGdaaZVruPaRmYMn3zoxhaccMoA8qEZUuSy2Um/image.png","https://files.peakd.com/file/peakd-hive/blesspatrick/7oGq5bN9-image.png","https://files.peakd.com/file/peakd-hive/blesspatrick/s90x0uSu-image.png"]}" |
| created | 2020-05-25 14:35:24 |
| last_update | 2020-05-25 14:42:42 |
| depth | 0 |
| children | 0 |
| last_payout | 2020-06-01 14:35:24 |
| cashout_time | 1969-12-31 23:59:59 |
| total_payout_value | 0.498 HBD |
| curator_payout_value | 0.497 HBD |
| pending_payout_value | 0.000 HBD |
| promoted | 0.000 HBD |
| body_length | 8,535 |
| author_reputation | 1,258,806,405,436 |
| root_title | "BTC/USD - Bitcoin new complete analysis - Immediate post-halving time" |
| beneficiaries | [] |
| max_accepted_payout | 1,000,000.000 HBD |
| percent_hbd | 10,000 |
| post_id | 97,581,321 |
| net_rshares | 2,819,199,861,123 |
| author_curate_reward | "" |
| voter | weight | wgt% | rshares | pct | time |
|---|---|---|---|---|---|
| djennyfloro | 0 | 6,108,729,307 | 46.43% | ||
| sward | 0 | 7,954,610,000 | 100% | ||
| forexbrokr | 0 | 862,070,502,192 | 100% | ||
| investprosper | 0 | 5,733,082,640 | 2.5% | ||
| rollandthomas | 0 | 1,290,896,969 | 3% | ||
| nancybriti | 0 | 31,770,930,993 | 100% | ||
| gwilberiol | 0 | 102,939,163,978 | 88.21% | ||
| viniciotricolor | 0 | 3,954,790,148 | 92.86% | ||
| passeggero | 0 | 1,794,368,030 | 83.57% | ||
| aicu | 0 | 1,673,362,869,415 | 92.86% | ||
| mindtrap-leo | 0 | 0 | 0.52% | ||
| leo.voter | 0 | 117,035,885,909 | 5% | ||
| tonimontana.leo | 0 | 0 | 0.53% | ||
| fuggitivo | 0 | 5,184,031,542 | 92.86% |