.png) <div class="text-justify"> This is a topic that surely most people know, however, there are many who start in this world of cryptocurrencies, enter HIVE in order to monetize their knowledge, in the end they dive into investments thanks to these platforms, but still they do not know anything about technical analysis or how to draw a trend line and this does not allow you to know where you are when investing or selling at a good point the coins generated by your content, this is not something that is very relevant but I am very aware, that at least many women on the platform have no idea how it works and my intention is to help those users who do not know about the subject. I am very careful when it comes to determine what trend has the currency I am analyzing, because depending on it is that I will make my investment to never go against the trend, it is for this reason, I thought it appropriate to talk about the trend lines and how to draw them correctly, in this way I can help the content creators of these platforms to have a good control of their money and their currencies and not sell at a bad point, just when the currency is about to make an upward momentum or buy just when the currency has already risen too much and comes a price correction or worse a trend change. </div> <br>  <center> ### What is a Trend Line and how to draw them? </center> <div class="text-justify"> A trend line is drawn by joining the lowest points of the price, those low peaks that the asset is forming in its path, in this way we can identify what trend and / or direction has a currency, either if it is up or down and when we know this, we can know where we are on the chart and can help us determine in which direction to make a prediction or otherwise an operation. Of course this does not mean that they should trade in its pure essence, but it can help as I said before to sell their currencies in good points graphically speaking. **To give an example of how we can draw a **"Trend Line"**, pay attention to the following images:** 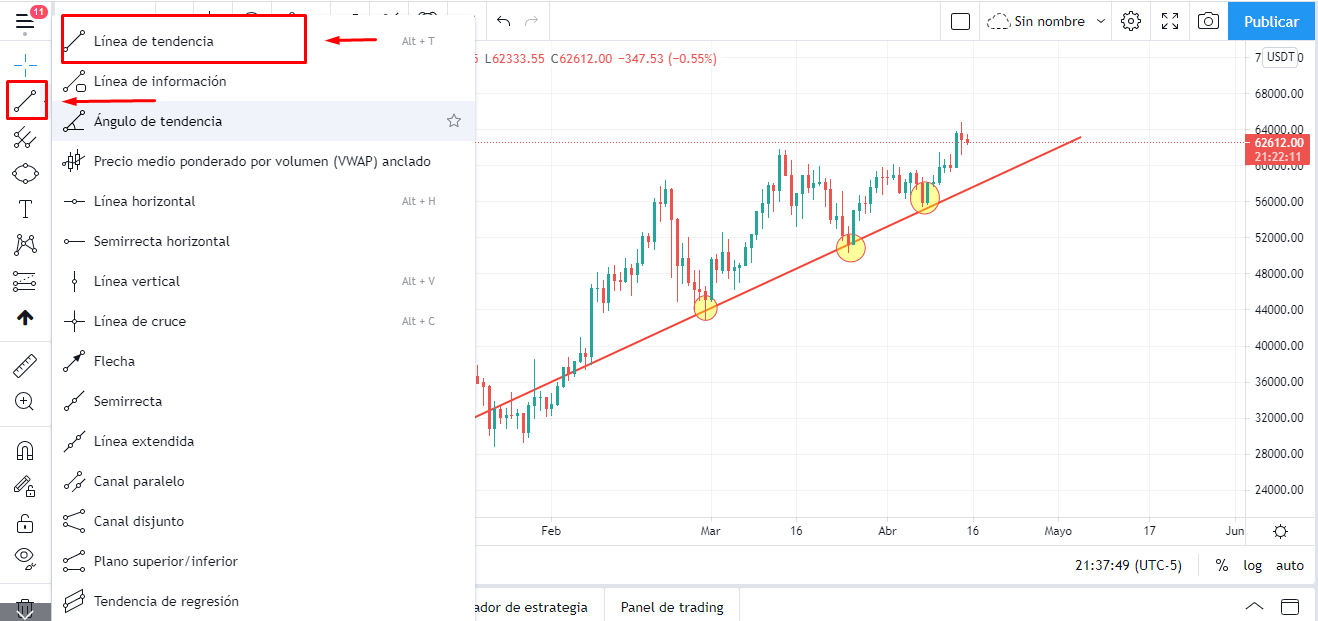 In this first image we can see where we can find the trendline tool to be able to plot it on the chart. We only have to click on the first box where we place the date pointing to the left to display the panel of options and we can see that in the first option is **"Trend Line"**. 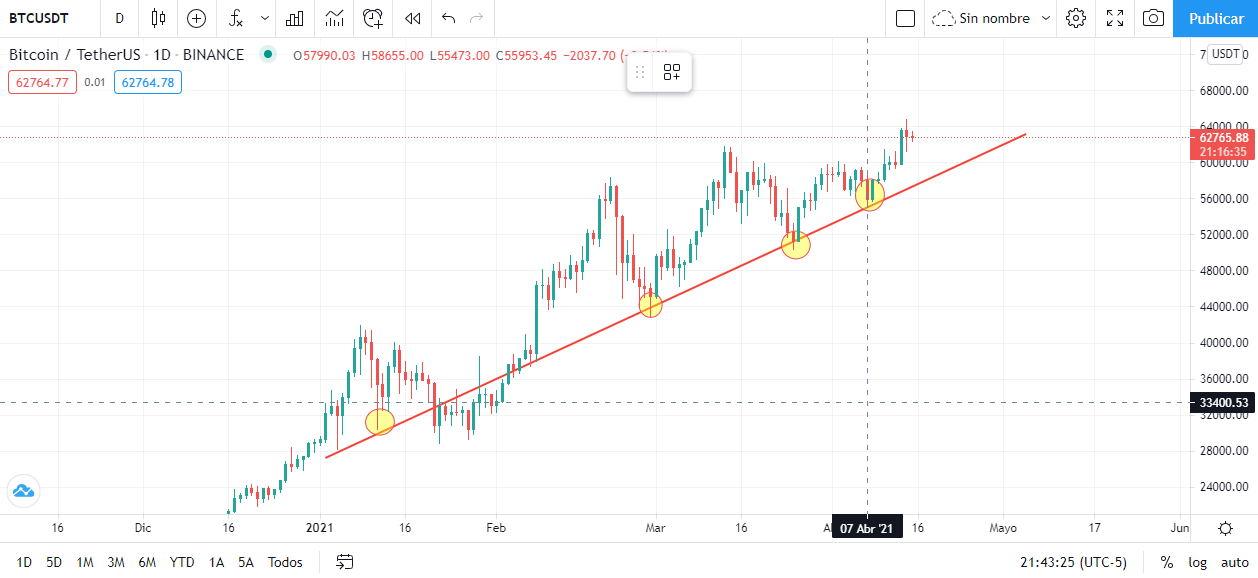 As you can see in this other image Once the tool is selected, we just have to go to the chart and move over the points we want to join and draw the line, as I said, we must join the minimum points of the price that are getting higher, these points can be seen marked with a yellow circle, where I seek to point out the minimum points that the price has made to join them and draw my line. </div> <br>  <center> ### What is the purpose of drawing a trend line? </center> <div class="text-justify"> The trend line shows us where the price of any asset is pointing at a given moment and time, which leads us to interpret that the **"Buyers"** are in control at this time, then, if we draw our line and see a scenario like the above in the images, we can realize that if we have Bitcoin in one of our wallets, it would not be good to sell them at this time, since the trace of these minimums that are increasingly higher, is showing us that the price most likely can continue to rise, in this way it is a bad idea to sell, as we would be possibly missing a great movement that would make us more money. This is one of the many interpretations that we can give to the lines, but what I want to be clear, is that with it we can place ourselves on the chart and see what is happening with the price, of course I do not want to make this explanation very complicated for those who do not know anything about trading or technical analysis, but the essence of how you can work and how with a simple trend line we can protect our money, very easily. </div> <br>  <center> ### Conclusion </center> <div class="text-justify"> This topic is one of the most basic in trading and in what is the **"Technical Analysis"**, with this I intend to help all newcomers who often want their currencies are revalued, but do not know anything about the graphics or how to do to understand what they tell you those bars of green and red smell called **"Japanese Candlesticks"**. Certainly there is a lot of fabric to cut in trading, there are many details, but little by little I can bring this information to everyone so that they can learn to make their money profitable with the little knowledge that I can bring them. If you like this type of content, please leave it in the comments and this way I could know what other topics based on technical analysis or trading that I know of course, I could bring to help those who can on the platform to understand more about these topics, specifically the newer ones who are entering, which basically what they need most is education. </div> <br> <center> ## Until next time and happy investing. </center> <br>  ***Join the official community here [Discord](https://discord.gg/CvnfTuBJ64)*** --- https://i.postimg.cc/d02nBjTg/banner-doradas.gif <center> ***Join the official Spanish community here [Discord](https://discord.gg/nwJpfYc)*** </center> Posted Using [LeoFinance <sup>Beta</sup>](https://leofinance.io/@cieliss/how-to-correctly-draw-trend-lines-on-a-chart)
| author | cieliss |
|---|---|
| permlink | how-to-correctly-draw-trend-lines-on-a-chart |
| category | hive-167922 |
| json_metadata | {"app":"leofinance/0.2","format":"markdown","tags":["leofinance","trading","finance","investment","technicalanalysis","economy","palnet","spt","neoxian"],"canonical_url":"https://leofinance.io/@cieliss/how-to-correctly-draw-trend-lines-on-a-chart","links":["https://discord.gg/CvnfTuBJ64","https://discord.gg/nwJpfYc"],"image":["https://images.hive.blog/DQmYMm2yrHfDB4k5X27fDQ5M1oNk25iMEsV6mHkjT5jSEzG/Final%20de%20Temporada%20_%20cartas%20_%20Actualizacion%20(11).png","https://images.hive.blog/DQmX2Dw35gUy2xrLncCDt8Wt4rGLhu1GftmES2RQDJfoMV6/image.png","https://images.hive.blog/DQmPjoPZtns42saAz6pTCyYny6U2kgcWtGyntnYP7FdnwwP/Donde%20encontrar%20una%20linea%20de%20tendencia.png","https://images.hive.blog/DQmUUDRXgwJnm8jSFvUDRTnvHfER2kB2PwG9BHqA8HFDLBt/Linea%20de%20tendencia%20GRAFICO.png","https://images.hive.blog/DQmXRjNCireMY6DNMEUPKYYJqcHZsAKWRzgn7Pke2PFx3ey/image.png","https://i.postimg.cc/d02nBjTg/banner-doradas.gif"]} |
| created | 2021-04-15 05:22:39 |
| last_update | 2021-04-15 05:22:39 |
| depth | 0 |
| children | 1 |
| last_payout | 2021-04-22 05:22:39 |
| cashout_time | 1969-12-31 23:59:59 |
| total_payout_value | 4.822 HBD |
| curator_payout_value | 3.238 HBD |
| pending_payout_value | 0.000 HBD |
| promoted | 0.000 HBD |
| body_length | 6,264 |
| author_reputation | 415,836,790,506,720 |
| root_title | "How to correctly draw trend lines on a chart" |
| beneficiaries | [] |
| max_accepted_payout | 1,000,000.000 HBD |
| percent_hbd | 10,000 |
| post_id | 103,054,765 |
| net_rshares | 11,966,696,174,218 |
| author_curate_reward | "" |
| voter | weight | wgt% | rshares | pct | time |
|---|---|---|---|---|---|
| tombstone | 0 | 26,007,194,743 | 1.2% | ||
| iobates | 0 | 98,776,425 | 2% | ||
| gerber | 0 | 101,237,526,276 | 7% | ||
| daan | 0 | 58,568,117,086 | 8% | ||
| ezzy | 0 | 57,203,776,068 | 7% | ||
| exyle | 0 | 55,905,521,174 | 7% | ||
| miketr | 0 | 7,216,685,737 | 5% | ||
| someguy123 | 0 | 138,036,314,575 | 7% | ||
| planosdeunacasa | 0 | 577,921,411 | 7% | ||
| sellergenius | 0 | 991,736,743 | 50% | ||
| automaton | 0 | 1,203,438,967 | 87% | ||
| itinerantph | 0 | 1,079,255,946 | 4% | ||
| dune69 | 0 | 1,107,625,518 | 6.3% | ||
| iansart | 0 | 12,541,968,422 | 7% | ||
| roomservice | 0 | 3,298,242,710 | 3% | ||
| rycharde | 0 | 527,178,799 | 10% | ||
| alphacore | 0 | 14,463,882,664 | 2.11% | ||
| techken | 0 | 2,265,702,378 | 3.5% | ||
| shitsignals | 0 | 3,364,725,928 | 7% | ||
| themarkymark | 0 | 2,490,251,157,802 | 8% | ||
| dineroconopcion | 0 | 583,119,741 | 7% | ||
| lenonmc21 | 0 | 25,406,487,523 | 100% | ||
| zonabitcoin | 0 | 600,713,304 | 7% | ||
| jeanlucsr | 0 | 1,143,653,766 | 0.7% | ||
| cflclosers | 0 | 4,317,233,381 | 11% | ||
| felander | 0 | 33,417,516,643 | 7% | ||
| accelerator | 0 | 229,944,052,801 | 14% | ||
| buildawhale | 0 | 5,940,989,951,160 | 8% | ||
| yogacoach | 0 | 6,580,568,816 | 7% | ||
| therealwolf | 0 | 491,798,464,461 | 4% | ||
| makerhacks | 0 | 26,679,816,252 | 8% | ||
| caladan | 0 | 766,704,496 | 6.3% | ||
| emrebeyler | 0 | 113,810,908,992 | 7% | ||
| smartsteem | 0 | 519,260,364,482 | 4% | ||
| hendersonp | 0 | 1,805,076,837 | 7% | ||
| fjcalduch | 0 | 14,591,948,623 | 7% | ||
| upmyvote | 0 | 6,018,649,699 | 8% | ||
| bengy | 0 | 845,046,693 | 0.7% | ||
| nealmcspadden | 0 | 7,591,783,838 | 7% | ||
| piotrgrafik | 0 | 45,270,767,891 | 6.93% | ||
| investyourvote | 0 | 3,381,928,287 | 6% | ||
| bellarulox | 0 | 636,131,800 | 50% | ||
| movement19 | 0 | 5,254,332,689 | 2% | ||
| ladysalsa | 0 | 1,256,072,238 | 7% | ||
| karmadorje | 0 | 2,284,260,399 | 30% | ||
| reazuliqbal | 0 | 28,001,148,667 | 7% | ||
| henlicps | 0 | 653,940,722 | 7% | ||
| simplymike | 0 | 5,729,608,842 | 4.89% | ||
| bestboom | 0 | 1,769,052,478 | 7% | ||
| freddio | 0 | 18,676,233,415 | 7% | ||
| bafi | 0 | 1,183,919,505 | 30% | ||
| steem.services | 0 | 7,627,386,874 | 1.75% | ||
| vensurfer61 | 0 | 911,703,560 | 50% | ||
| rocejuma | 0 | 659,800,177 | 100% | ||
| swisswitness | 0 | 4,495,256,533 | 7% | ||
| dariuska2008 | 0 | 552,358,472 | 50% | ||
| marivic10 | 0 | 1,820,401,937 | 5% | ||
| dalz | 0 | 25,164,152,863 | 3.5% | ||
| luppers | 0 | 2,624,189,438 | 3.5% | ||
| dlike | 0 | 49,860,021,957 | 7% | ||
| cubapl | 0 | 611,974,357 | 7% | ||
| voxmortis | 0 | 2,575,103,839 | 1.4% | ||
| pedrocanella | 0 | 12,434,250,703 | 12% | ||
| bobby.madagascar | 0 | 596,033,149 | 1.75% | ||
| dosh | 0 | 32,563,553,092 | 30% | ||
| ldp | 0 | 604,291,708 | 7% | ||
| berthold | 0 | 2,886,657,348 | 6% | ||
| merlin7 | 0 | 17,423,342,315 | 7% | ||
| marianaemilia | 0 | 51,505,632,774 | 30% | ||
| followjohngalt | 0 | 21,877,506,958 | 6.3% | ||
| erarium | 0 | 6,067,008,725 | 100% | ||
| cakemonster | 0 | 3,921,664,765 | 3.5% | ||
| sparklemotion | 0 | 0 | 10% | ||
| permaculturedude | 0 | 2,709,482,407 | 7% | ||
| brancarosamel | 0 | 6,832,424,421 | 6% | ||
| ctime | 0 | 452,432,137,943 | 5% | ||
| thekillingqueen | 0 | 194,771,613 | 12.22% | ||
| limka | 0 | 62,921,161 | 50% | ||
| haikusailor | 0 | 618,185,868 | 7% | ||
| thelogicaldude | 0 | 13,627,590,272 | 10% | ||
| mfblack | 0 | 3,389,996,764 | 6.65% | ||
| caaio | 0 | 1,283,784,931 | 7.5% | ||
| epicdice | 0 | 1,236,053,839 | 1.2% | ||
| trxjjbtc | 0 | 556,695,536 | 7% | ||
| imagenius | 0 | 677,662,667 | 7% | ||
| threejay | 0 | 1,669,697,790 | 3.5% | ||
| bastter | 0 | 12,126,375,191 | 12% | ||
| steemindian | 0 | 520,710,604 | 3.5% | ||
| milu-the-dog | 0 | 3,079,222,497 | 7% | ||
| triplea.bot | 0 | 1,971,480,573 | 7% | ||
| steem.leo | 0 | 64,690,586,732 | 7% | ||
| elgranpoeta | 0 | 3,119,860,619 | 7% | ||
| asteroids | 0 | 718,873,674 | 6.3% | ||
| addax | 0 | 1,078,938,775 | 100% | ||
| botante | 0 | 3,120,698,180 | 1.05% | ||
| beta500 | 0 | 8,281,153,910 | 7% | ||
| maxuvd | 0 | 48,834,333,920 | 8% | ||
| gerbo | 0 | 38,271,934 | 7% | ||
| toni.curation | 0 | 141,703,190 | 4% | ||
| empoderat.leo | 0 | 0 | 7% | ||
| ribary | 0 | 2,361,584,025 | 3.5% | ||
| splinterzine | 0 | 1,074,376,795 | 30% | ||
| mice-k | 0 | 21,277,898,769 | 7% | ||
| dpend.active | 0 | 1,362,379,400 | 1.4% | ||
| monster-burner | 0 | 550,506,056 | 3.5% | ||
| dcityrewards | 0 | 358,007,545,863 | 7% | ||
| hiveonboard | 0 | 7,594,217,766 | 3% | ||
| hivelist | 0 | 1,591,229,161 | 0.7% | ||
| poshbot | 0 | 5,065,895,469 | 8% | ||
| hivecur | 0 | 13,756,311,049 | 7% | ||
| recoveryinc | 0 | 2,490,255,633 | 4% | ||
| francielis | 0 | 5,567,573,890 | 100% | ||
| cryptoanalist | 0 | 6,222,504,407 | 100% | ||
| dying | 0 | 9,297,814,048 | 4% | ||
| bamrepa | 0 | 521,108,726 | 50% | ||
| seuamiguto | 0 | 635,010,769 | 30% | ||
| hivechat | 0 | 865,424,494 | 3.5% | ||
| ravthijo | 0 | 2,538,288,140 | 84.7% | ||
| brunyson | 0 | 596,874,748 | 21% | ||
| carlosro | 0 | 2,028,068,480 | 30% | ||
| samrisso | 0 | 99,427,302,919 | 4% | ||
| giemo | 0 | 672,397,294 | 30% | ||
| robertkass | 0 | 528,421,171 | 15% | ||
| brofi | 0 | 26,671,070,778 | 1% |
Congratulations @cieliss! You have completed the following achievement on the Hive blockchain and have been rewarded with new badge(s) :

<table><tr><td><img src="https://images.hive.blog/60x70/http://hivebuzz.me/@cieliss/upvoted.png?202104150549"></td><td>You received more than 4250 upvotes.<br>Your next target is to reach 4500 upvotes.</td></tr>
</table>

<sub>_You can view your badges on [your board](https://hivebuzz.me/@cieliss) and compare yourself to others in the [Ranking](https://hivebuzz.me/ranking)_</sub>
<sub>_If you no longer want to receive notifications, reply to this comment with the word_ `STOP`</sub>


###### Support the HiveBuzz project. [Vote](https://hivesigner.com/sign/update_proposal_votes?proposal_ids=%5B%22109%22%5D&approve=true) for [our proposal](https://peakd.com/me/proposals/147)!
| author | hivebuzz |
|---|---|
| permlink | hivebuzz-notify-cieliss-20210415t060847000z |
| category | hive-167922 |
| json_metadata | {"image":["http://hivebuzz.me/notify.t6.png"]} |
| created | 2021-04-15 06:08:45 |
| last_update | 2021-04-15 06:08:45 |
| depth | 1 |
| children | 0 |
| last_payout | 2021-04-22 06:08:45 |
| cashout_time | 1969-12-31 23:59:59 |
| total_payout_value | 0.000 HBD |
| curator_payout_value | 0.000 HBD |
| pending_payout_value | 0.000 HBD |
| promoted | 0.000 HBD |
| body_length | 820 |
| author_reputation | 368,228,566,674,318 |
| root_title | "How to correctly draw trend lines on a chart" |
| beneficiaries | [] |
| max_accepted_payout | 1,000,000.000 HBD |
| percent_hbd | 10,000 |
| post_id | 103,055,332 |
| net_rshares | 0 |