create account

Technical Analysis Tutorial-Moving Averages by cloudconnect

View this thread on: hive.blogpeakd.comecency.com
· @cloudconnect ·
$17.43
Technical Analysis Tutorial-Moving Averages
<center><h1>Welcome to CloudConnect Studios</h1></center>
<center><h3>The MultiMedia CrytpoSource</h3></center>
---
---
https://steemitimages.com/DQmapQG7xhxbgj2sLE5kUgDKsHCZxzmH2uVrodt4duhL2Pc/image.png
<center><h4>***basic reading level***</h4></center>

Good day and night internet folk and steemians!!

Today we would like to bring you part 1 of a 2-part tutorial on one method of using the Technical Analysis Indicator: The Moving Average.

Thanks to our buddy Scott way back when for helping us to understand his method of using the MA. We will present our perspective on this.

What is a Moving Average (MA)? For TA, this means that the price will be averaged for a number of [candles](http://www.stock-trading-infocentre.com/candle-wicks.html):

![Screenshot 2018-03-04 at 17.44.28.png](https://steemitimages.com/DQmdpV7j8CZ7qENhHsMbRt7DeHwkUoHA6QjA1ecTbrGzABJ/Screenshot%202018-03-04%20at%2017.44.28.png)

So let's say we have a moving average of interval 5:

![Screenshot 2018-03-04 at 17.50.57.png](https://steemitimages.com/DQmVLSTkJhKRKZXTN2PsF2hw7MSBSvd74ASMGVEvWPCZexi/Screenshot%202018-03-04%20at%2017.50.57.png)

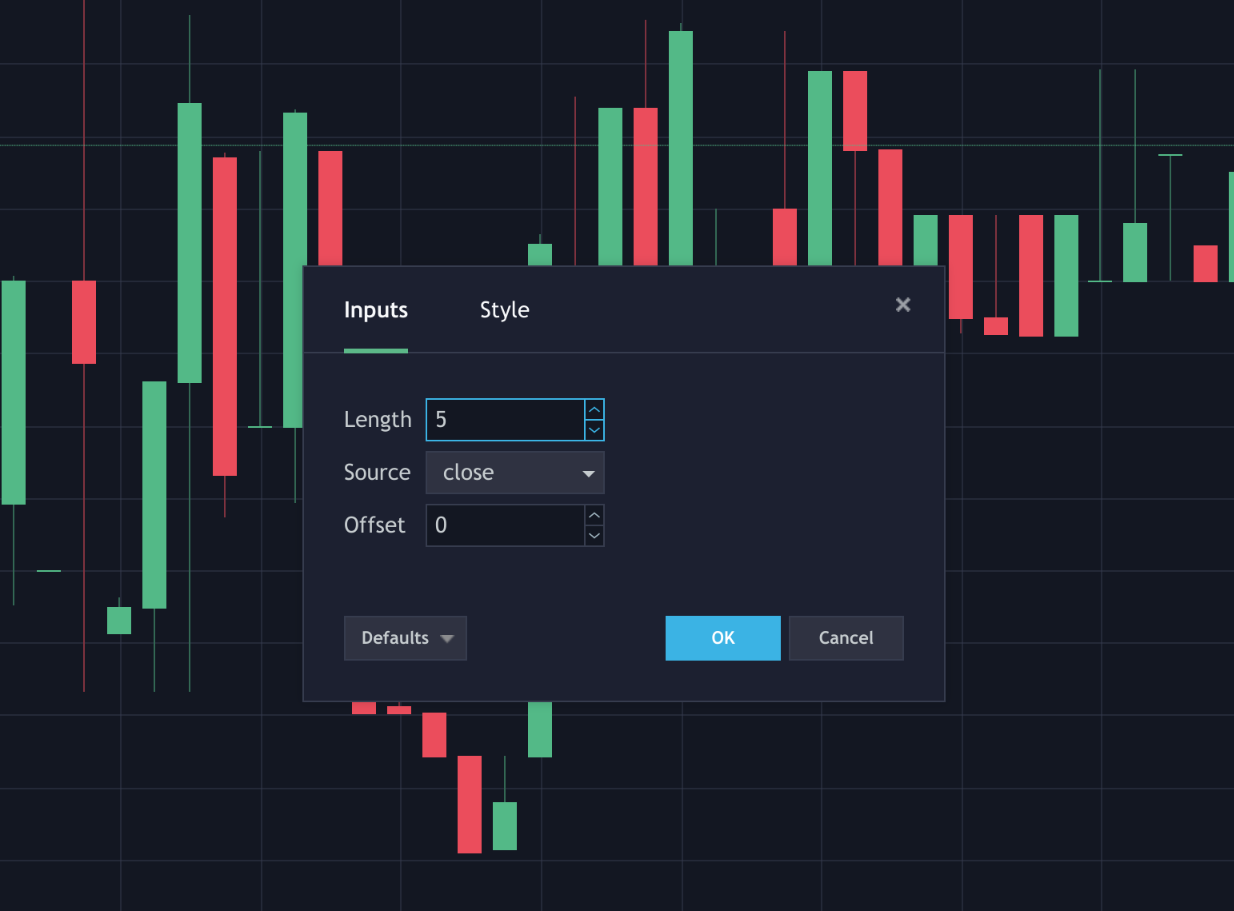
As you can see above on tradingview, interval is called length.

This means the average of the close prices (the last price of the candle's time space) of the last 5 candles. 

If the close prices were **[3,4,3,6,4]**, then the program would compute:
**((3+4+3+6+4)/5)** or **(20/5)=4**

The indicator is displayed as a curvy line which moves with the price. I like to think of the interval as the weight. A 400 length average moves more slowly and needs a much more drastic price swing for it to appear on the average line than an average of 5.

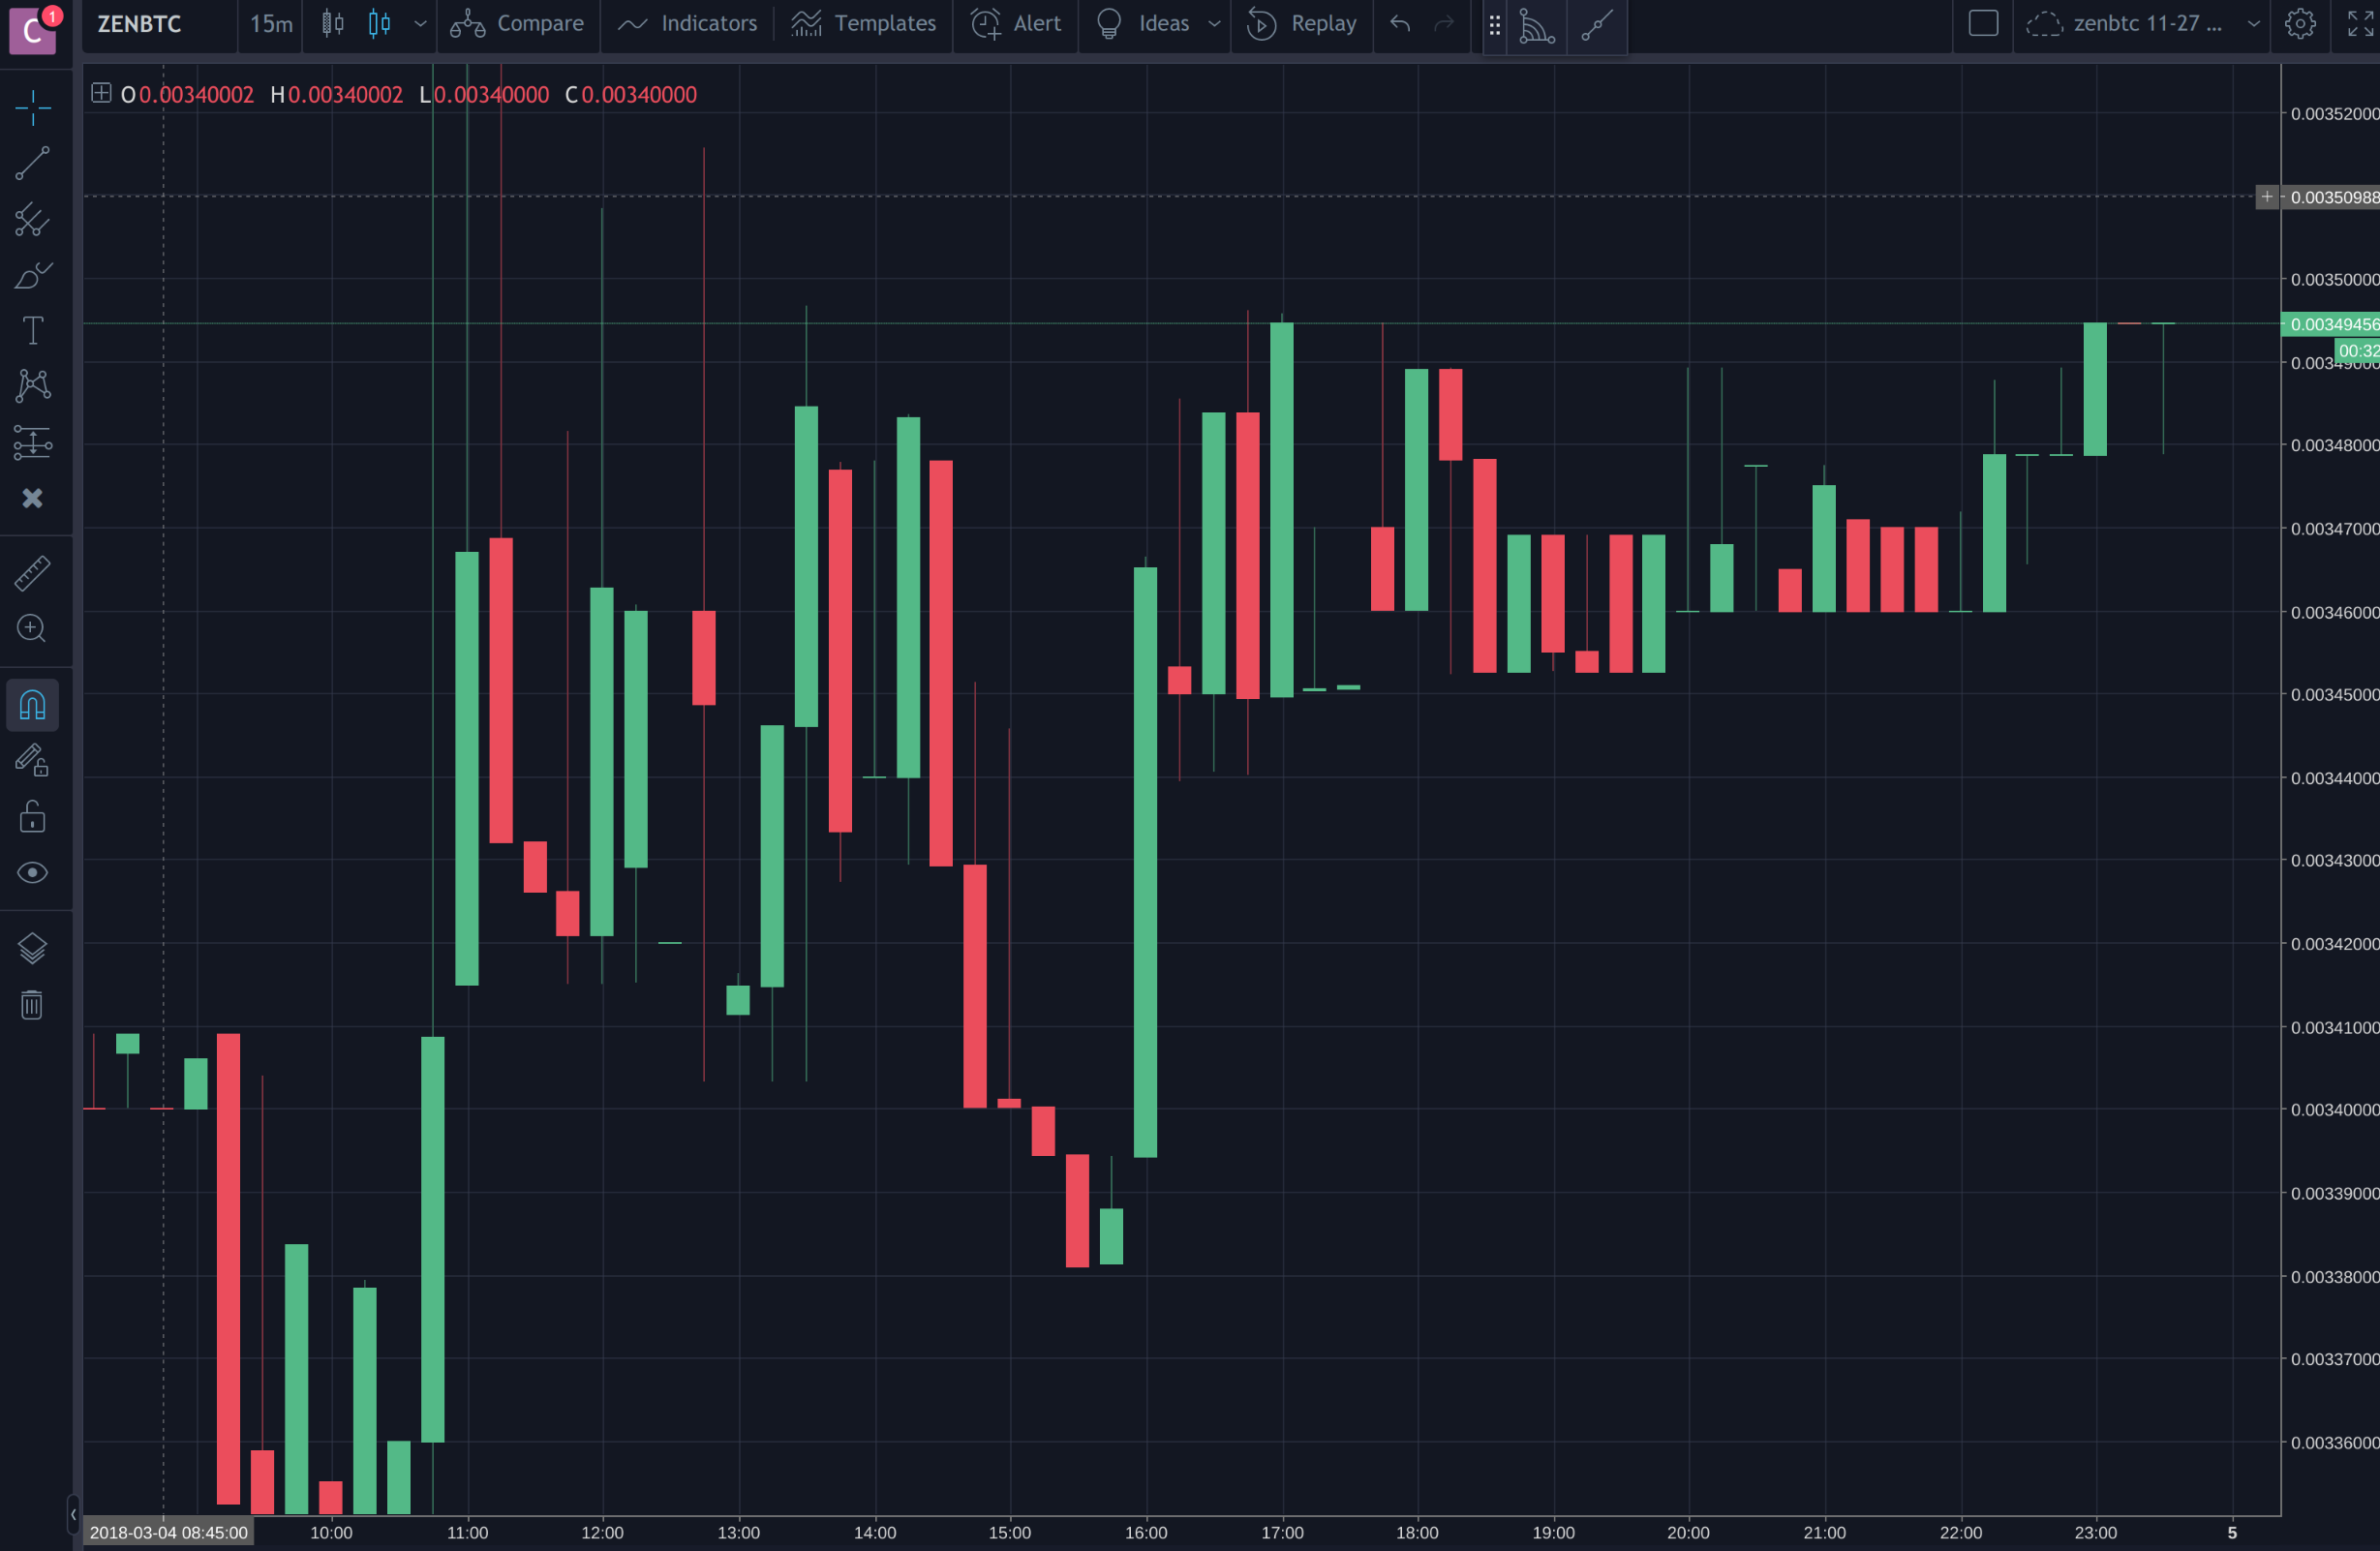
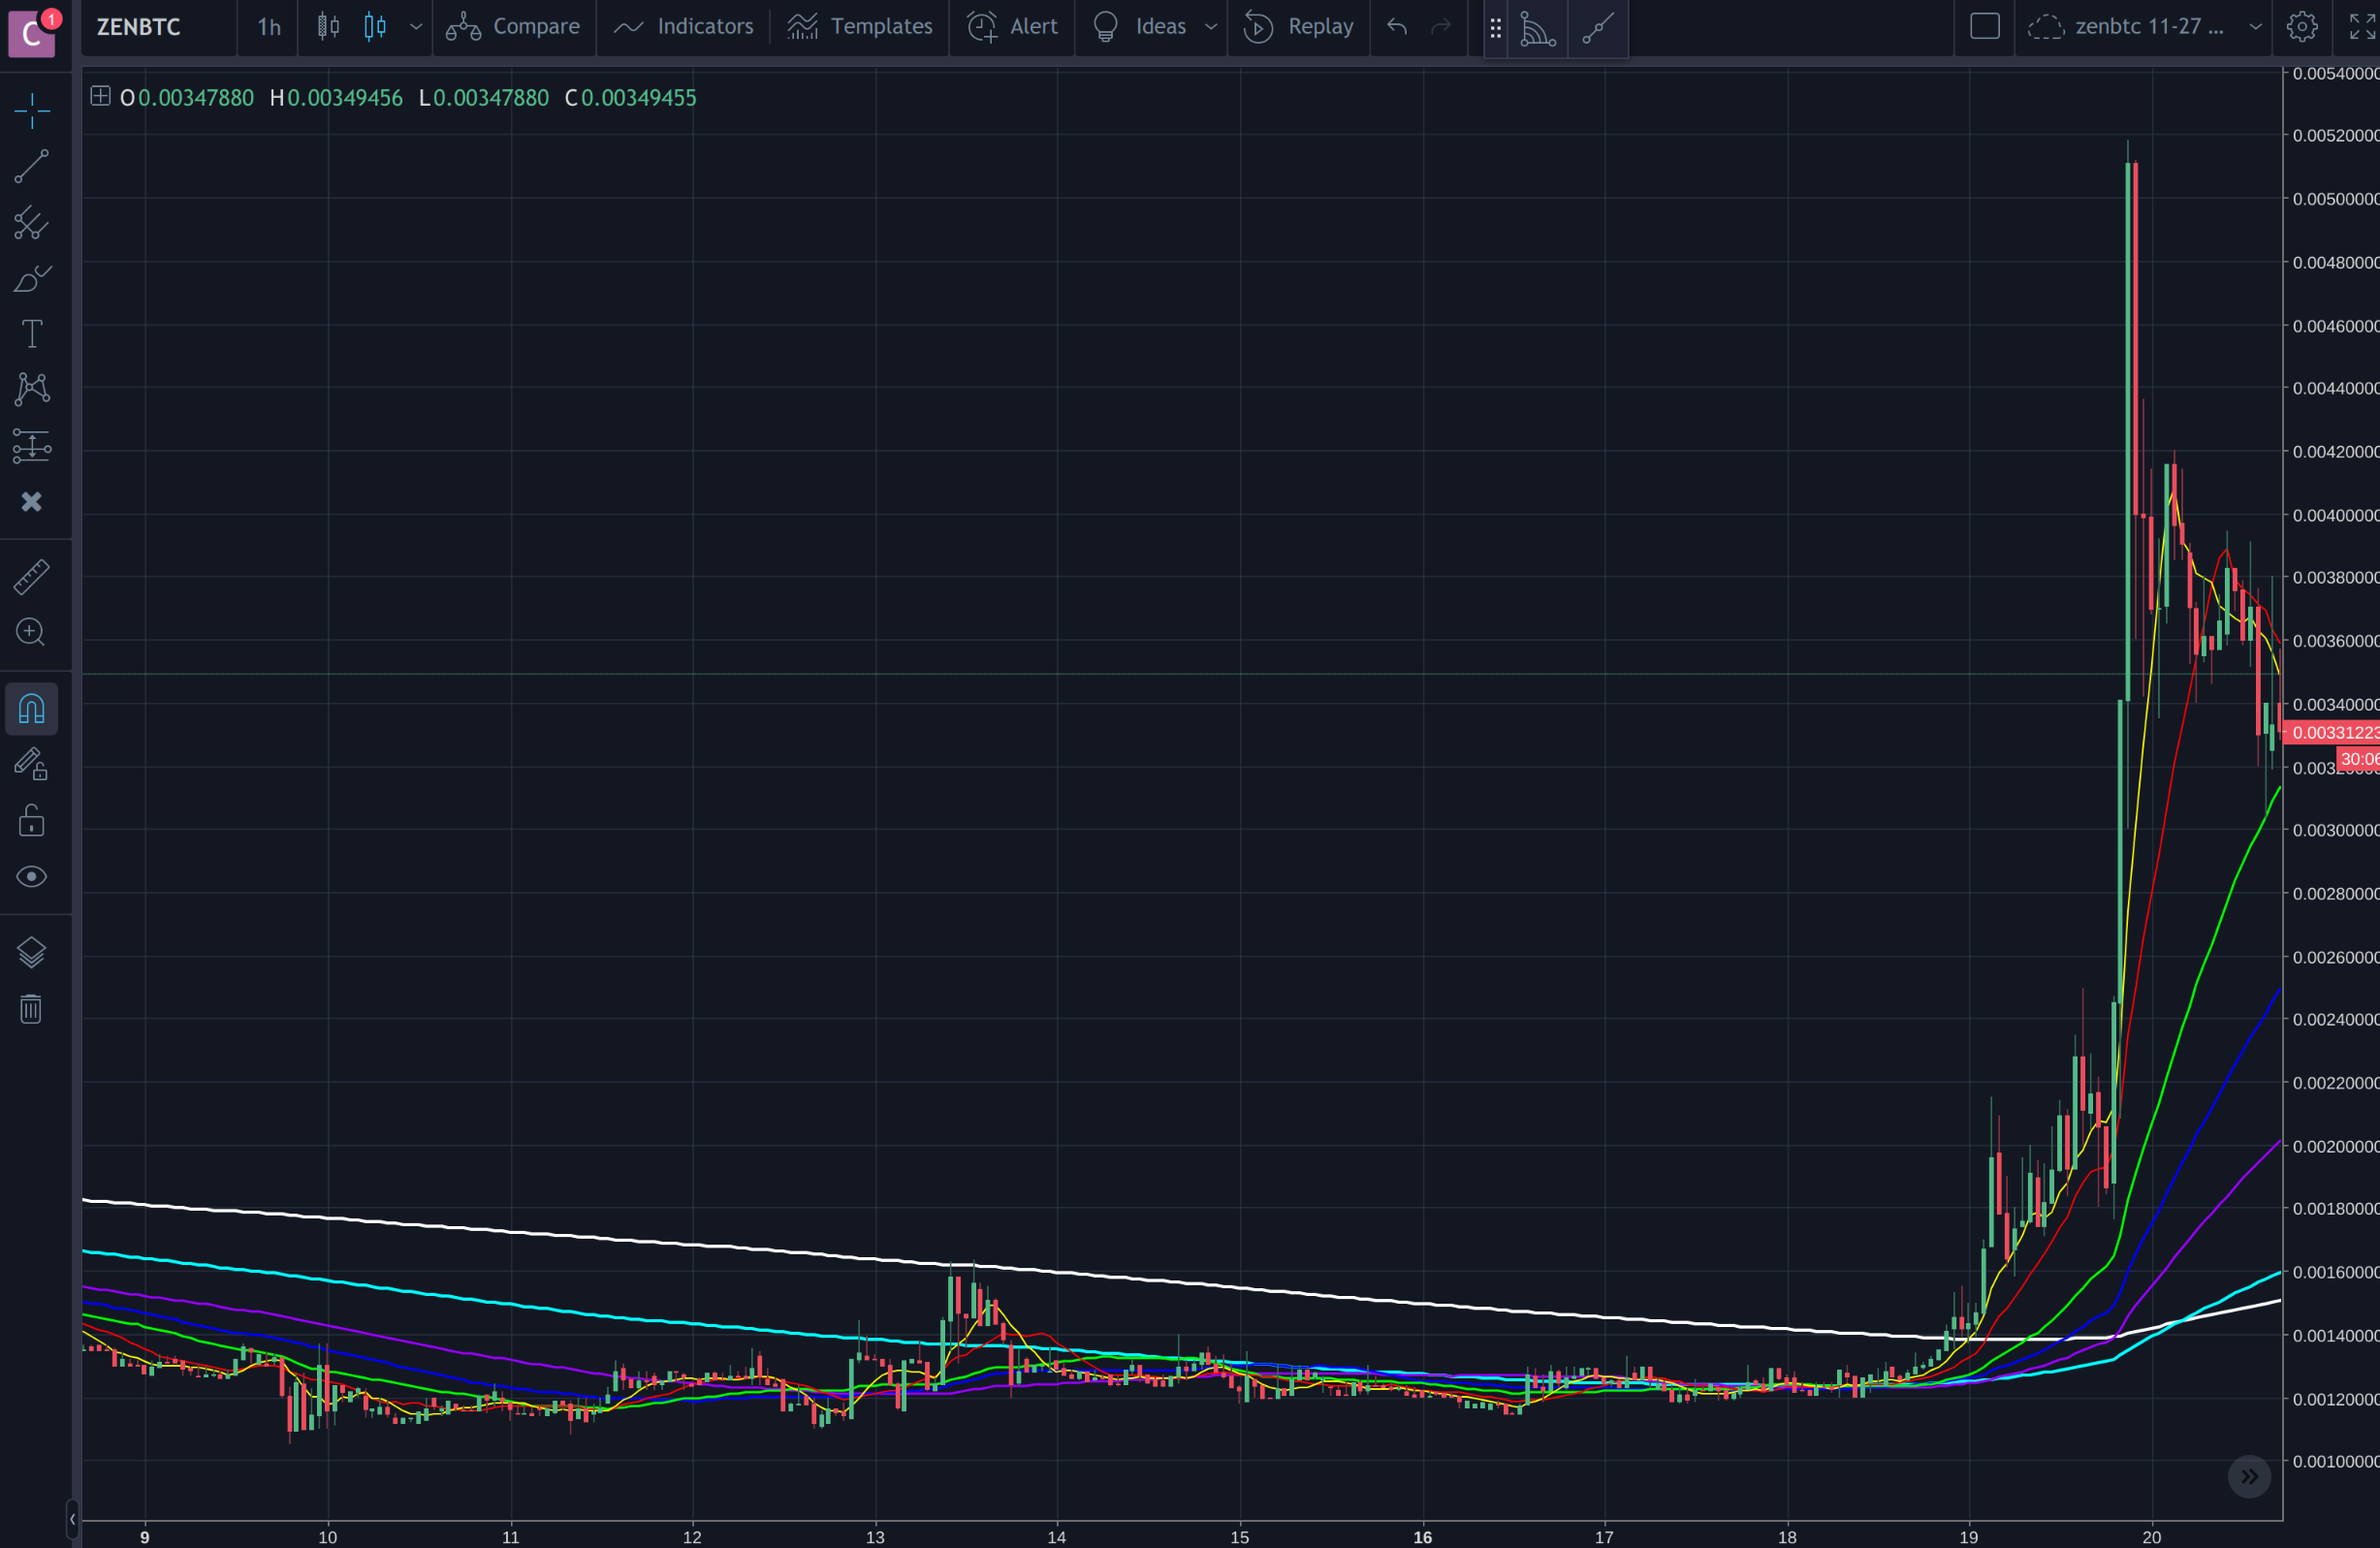
Let's dig into a chart, shall we?
Here's an overview of a ZenCash chart. ZenCash typically has an oxymoronic bit of stable volatility/controlled chaos. 

![Screenshot 2018-03-04 at 17.28.40.png](https://steemitimages.com/DQmUrtJx3wTHfySL988Msq615PaHxXxH5XB8bDJxUbEUBZP/Screenshot%202018-03-04%20at%2017.28.40.png)

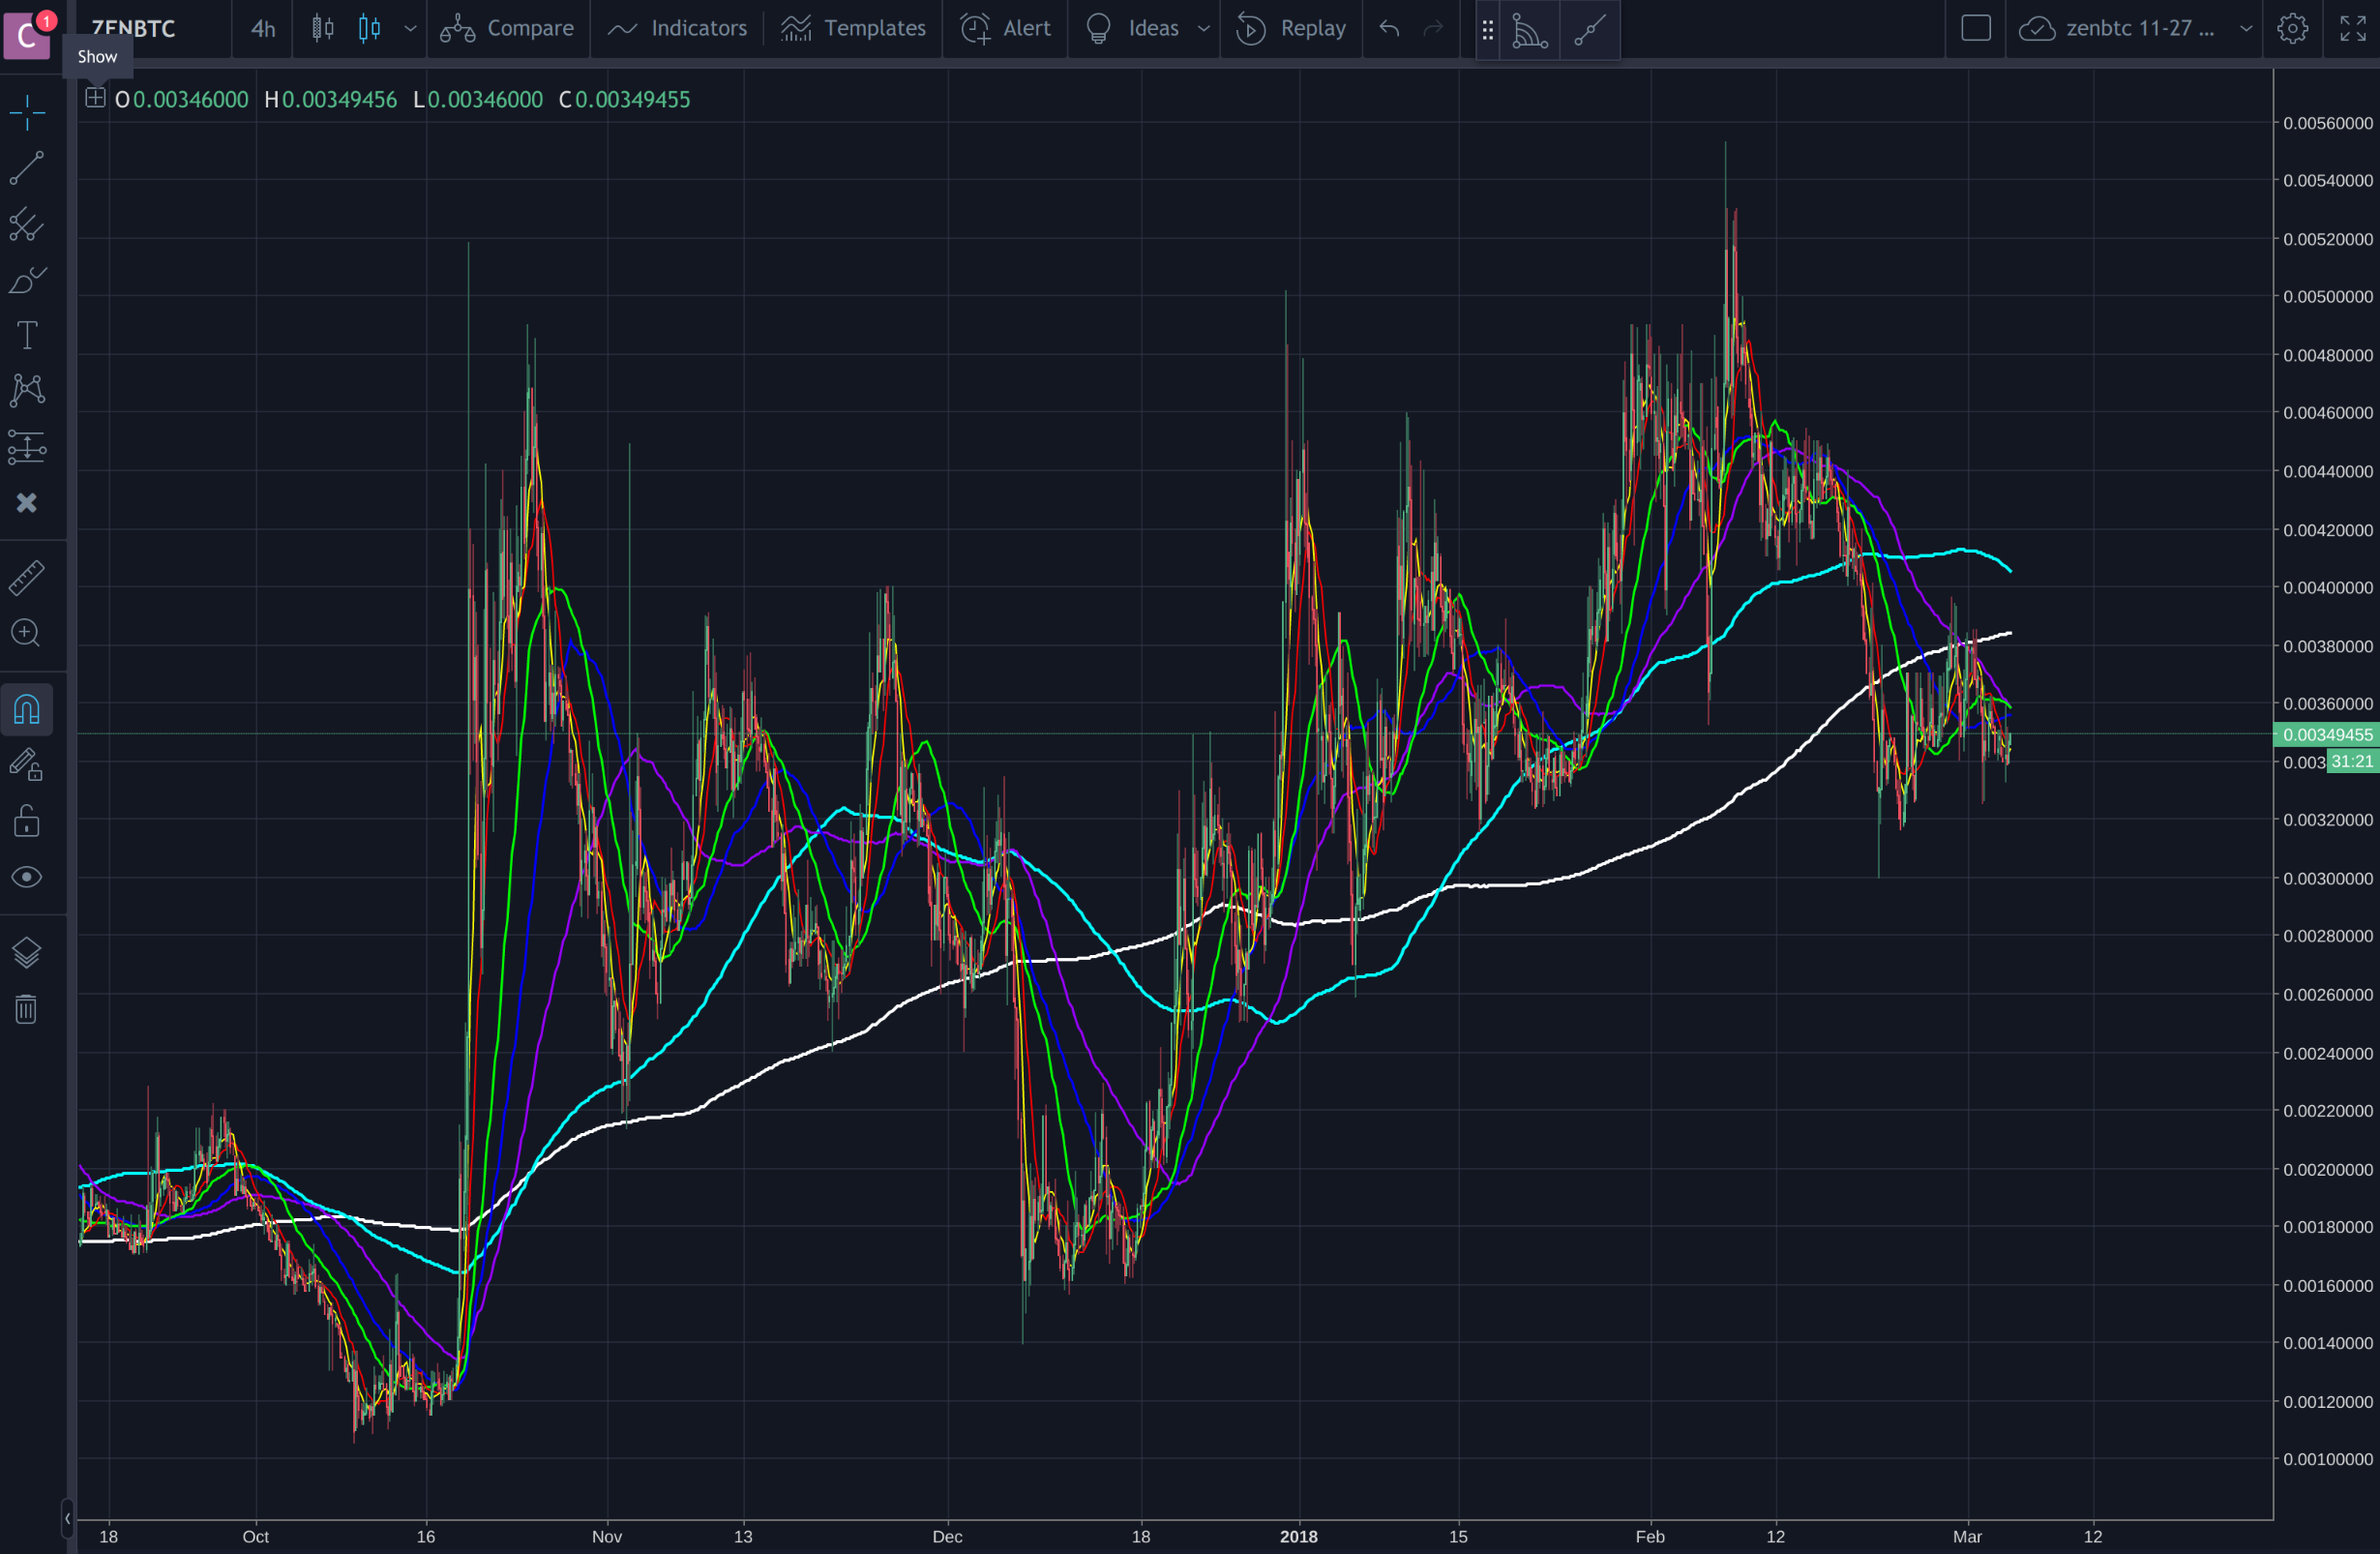
Can you guess which lines are the "heavy" MAs and which are the "light?"

In the white and the light blue are the heaviest. The light blue is lighter than the white. Both are in the hundreds scale.

The purple, blue, and green are my "middle" weight MAs. Below 100 but above 10.

Next, I will zoom in to show you the super light weights:

![Screenshot 2018-03-04 at 18.18.19.png](https://steemitimages.com/DQmT8kfE56zAVAMkhrV3pWPM7PfQu7eMaqWrgbXfksKkWBF/Screenshot%202018-03-04%20at%2018.18.19.png)

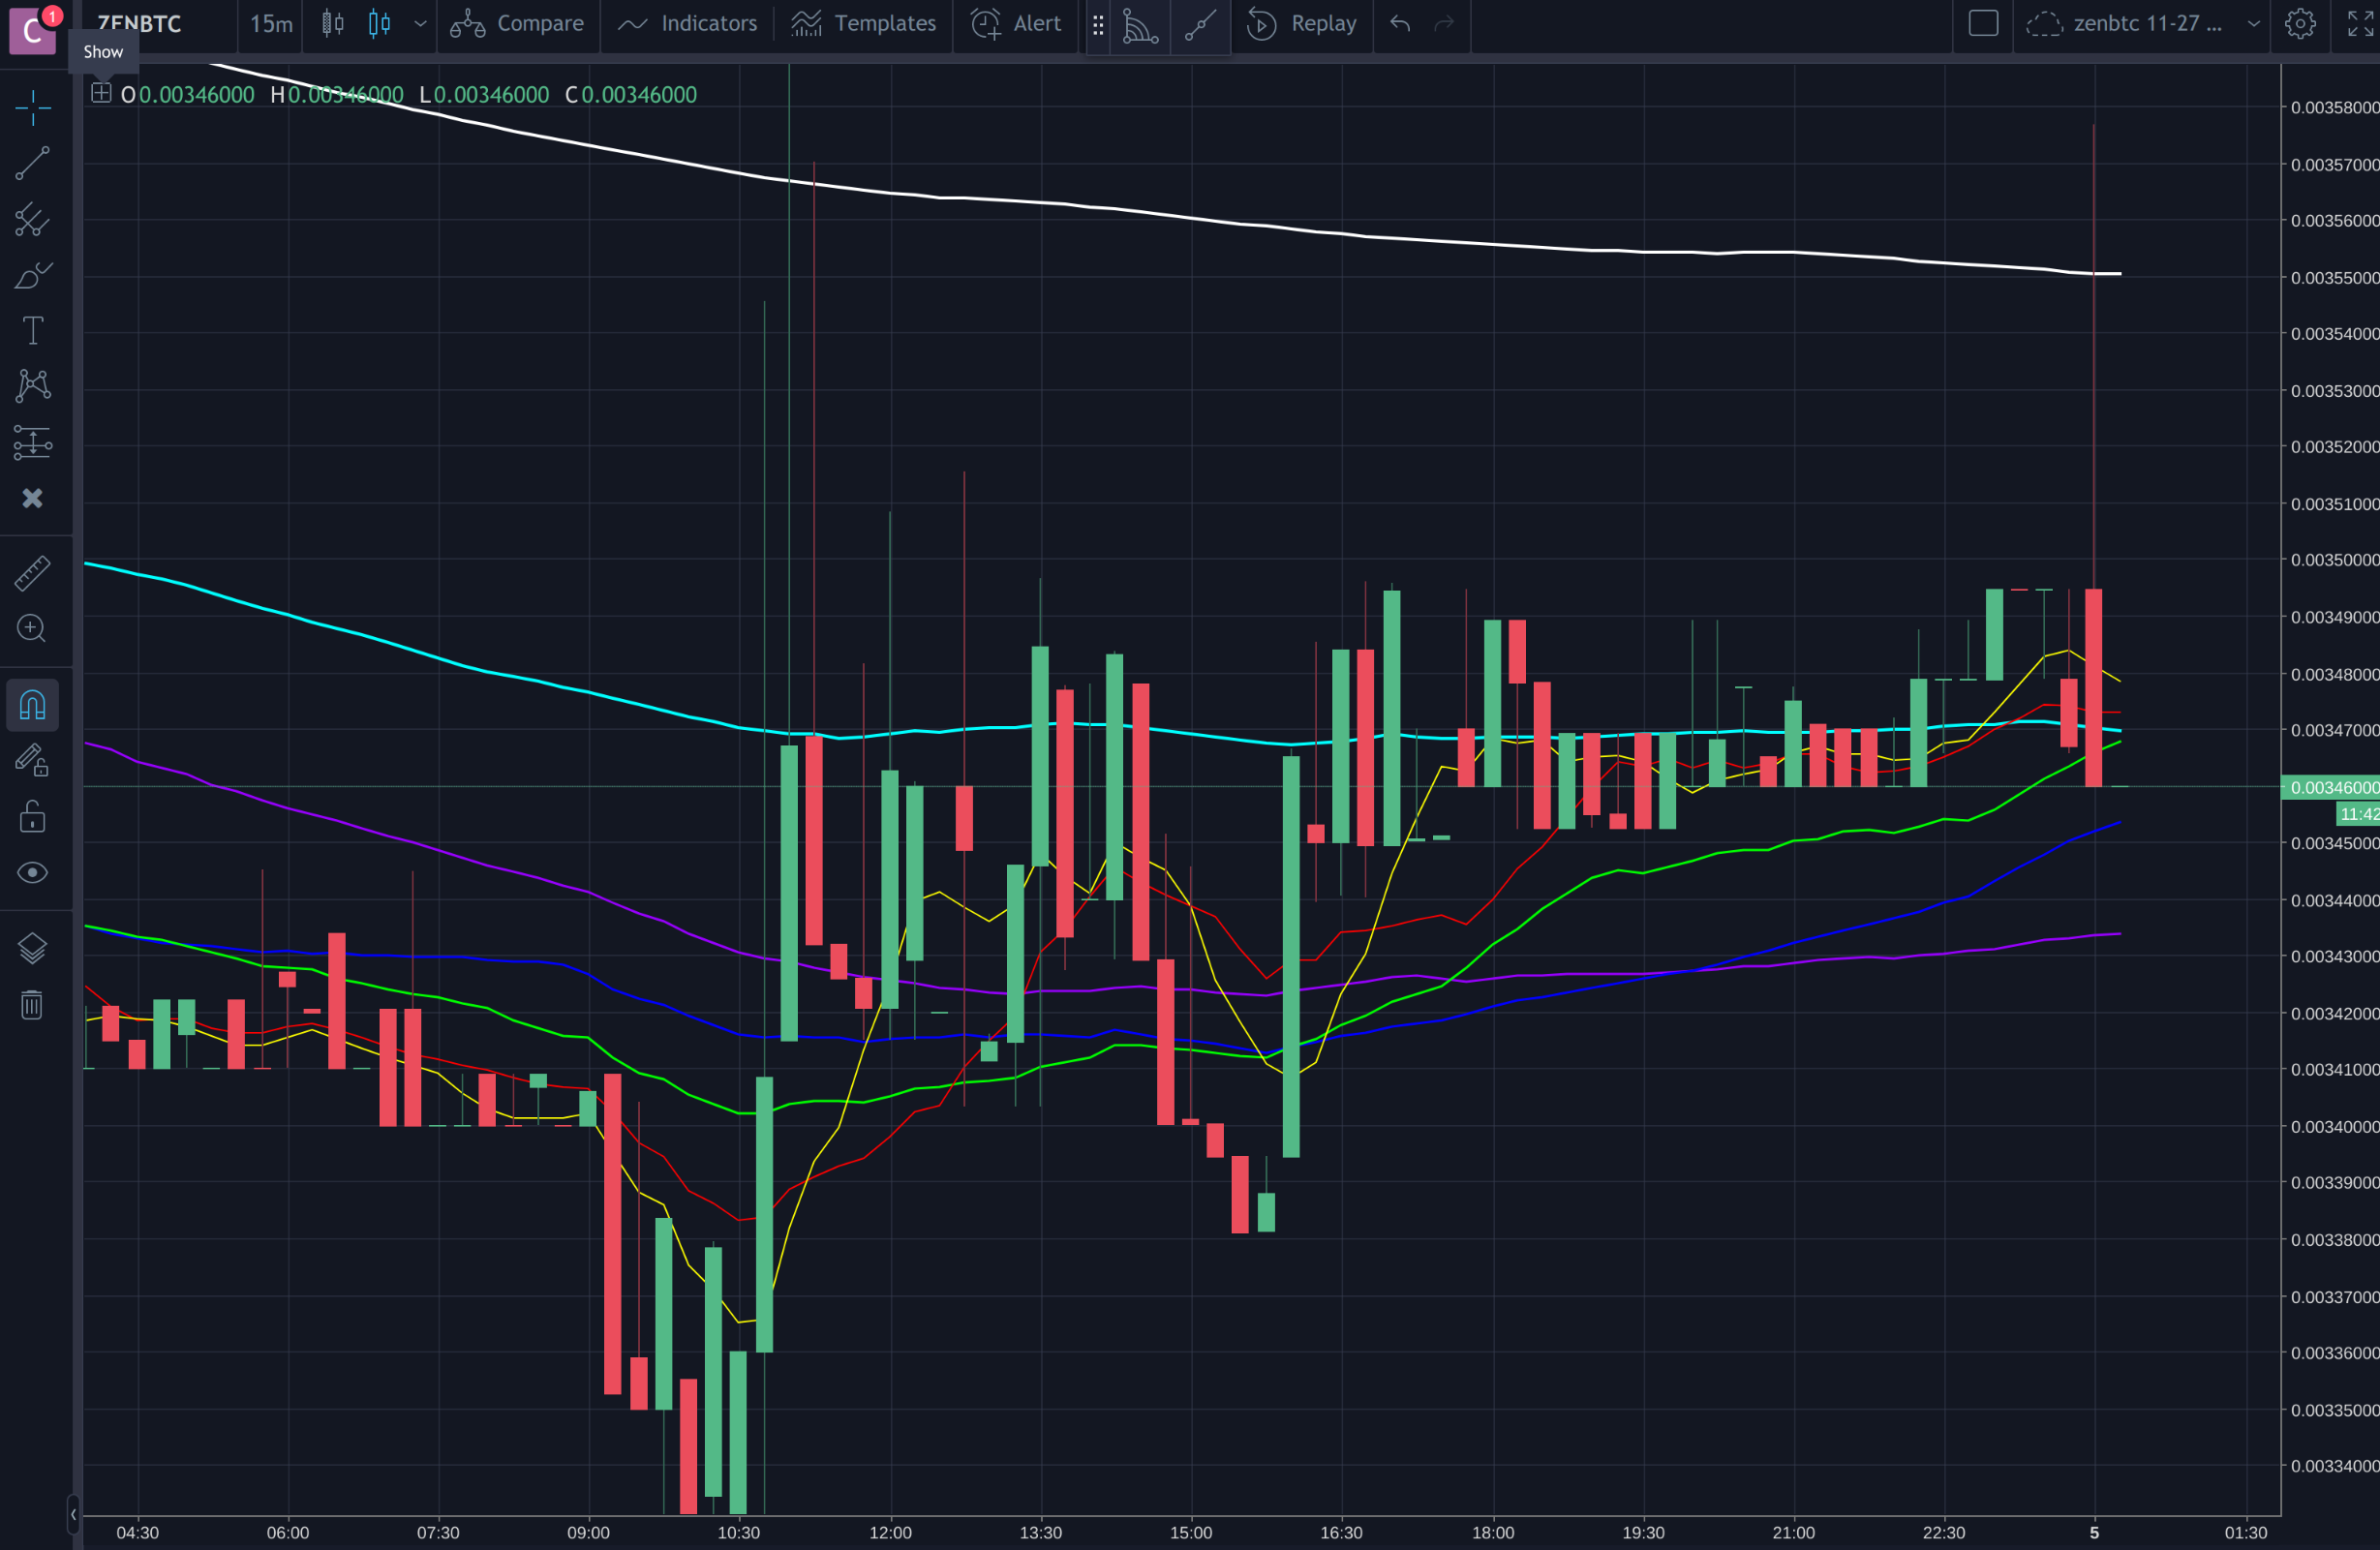
I have two "light" MAs here. These are around 10. Sometimes I use different combinations of MA intervals to consider different scales. You can experiment with different intervals and their numerical relationships with each other.

Next, I will describe a way you might use these indicators.

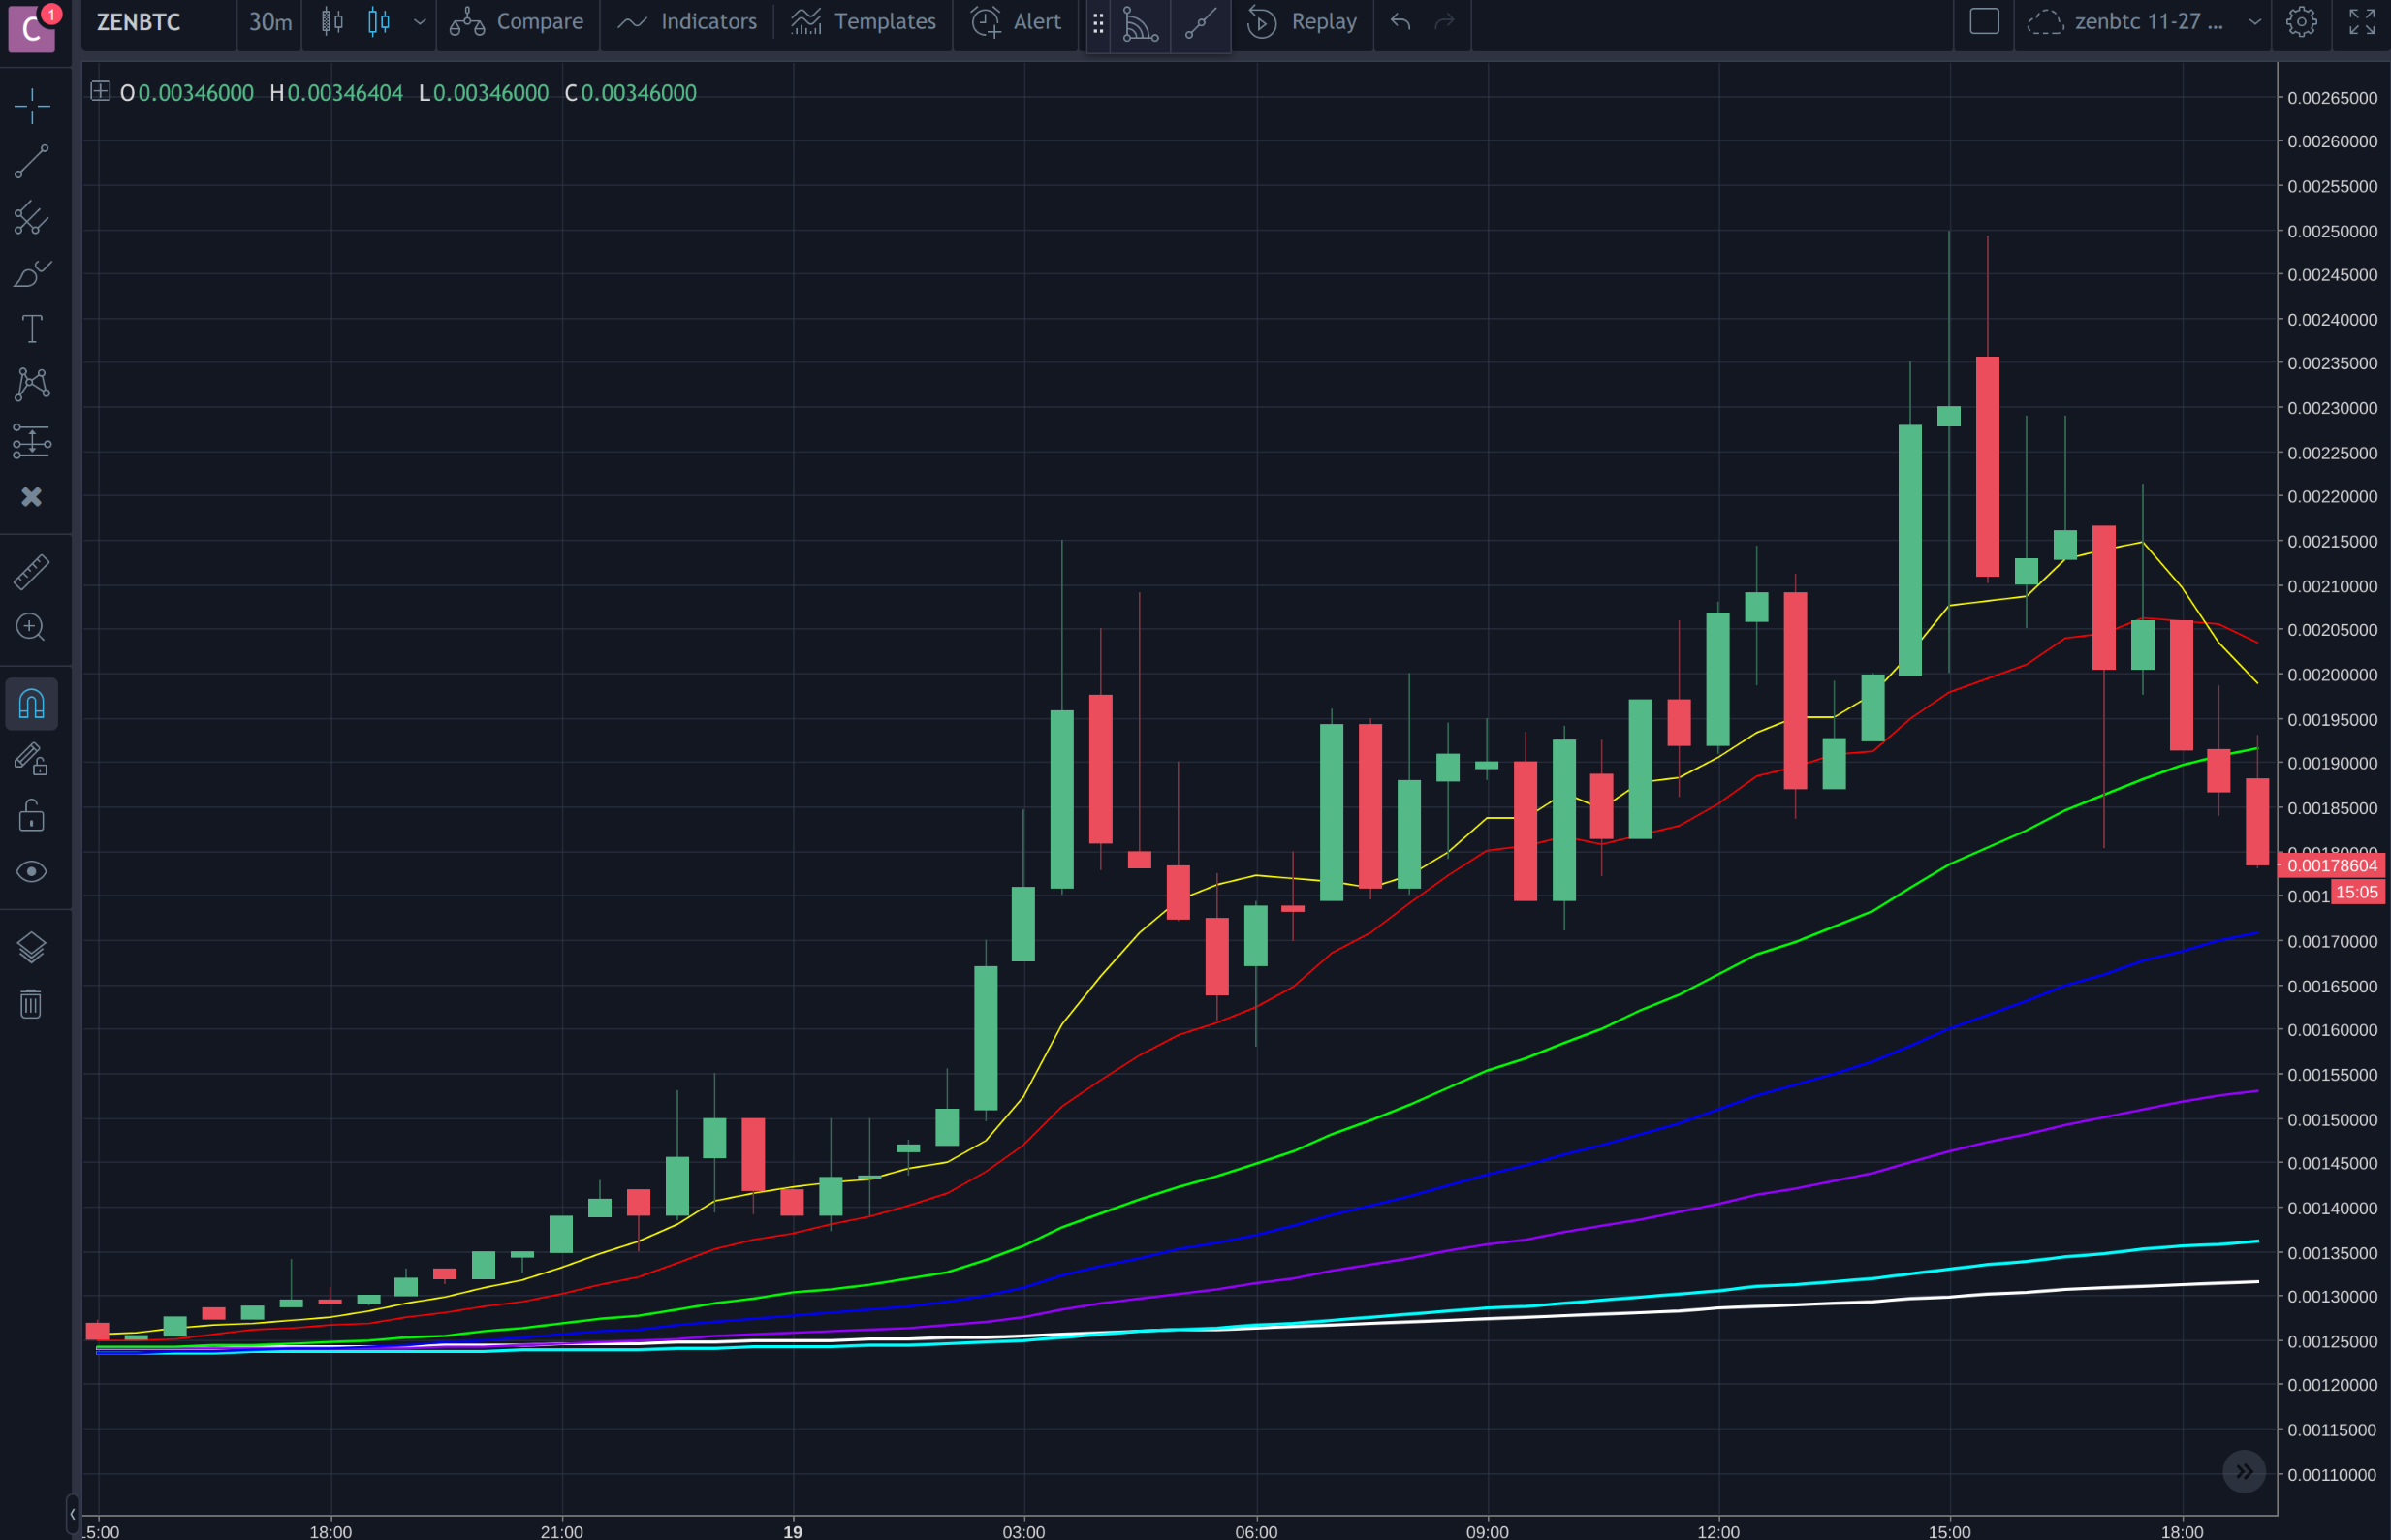
Take this massive pump on ZEN back in October. Wouldn't you love to buy at the bottom and sell at the top of that phat patty?

![Screenshot 2018-03-04 at 17.29.55.png](https://steemitimages.com/DQmaoBn1wfa5cjr8y5D8gC8grmqwUNW7r23TpE4GgLx8CHW/Screenshot%202018-03-04%20at%2017.29.55.png)

It's all about when a lighter moving average crosses a heavier one. On one timescale, the average is rising and this shows momentum.
<center>**An object in motion will stay in motion.**</center>

Here's some freebies:
![Screenshot 2018-03-04 at 18.54.08.png](https://steemitimages.com/DQmSudHqubpipZXfGoVWhQhXRZEhmFAt6xYUv1uTiMUCQZQ/Screenshot%202018-03-04%20at%2018.54.08.png)

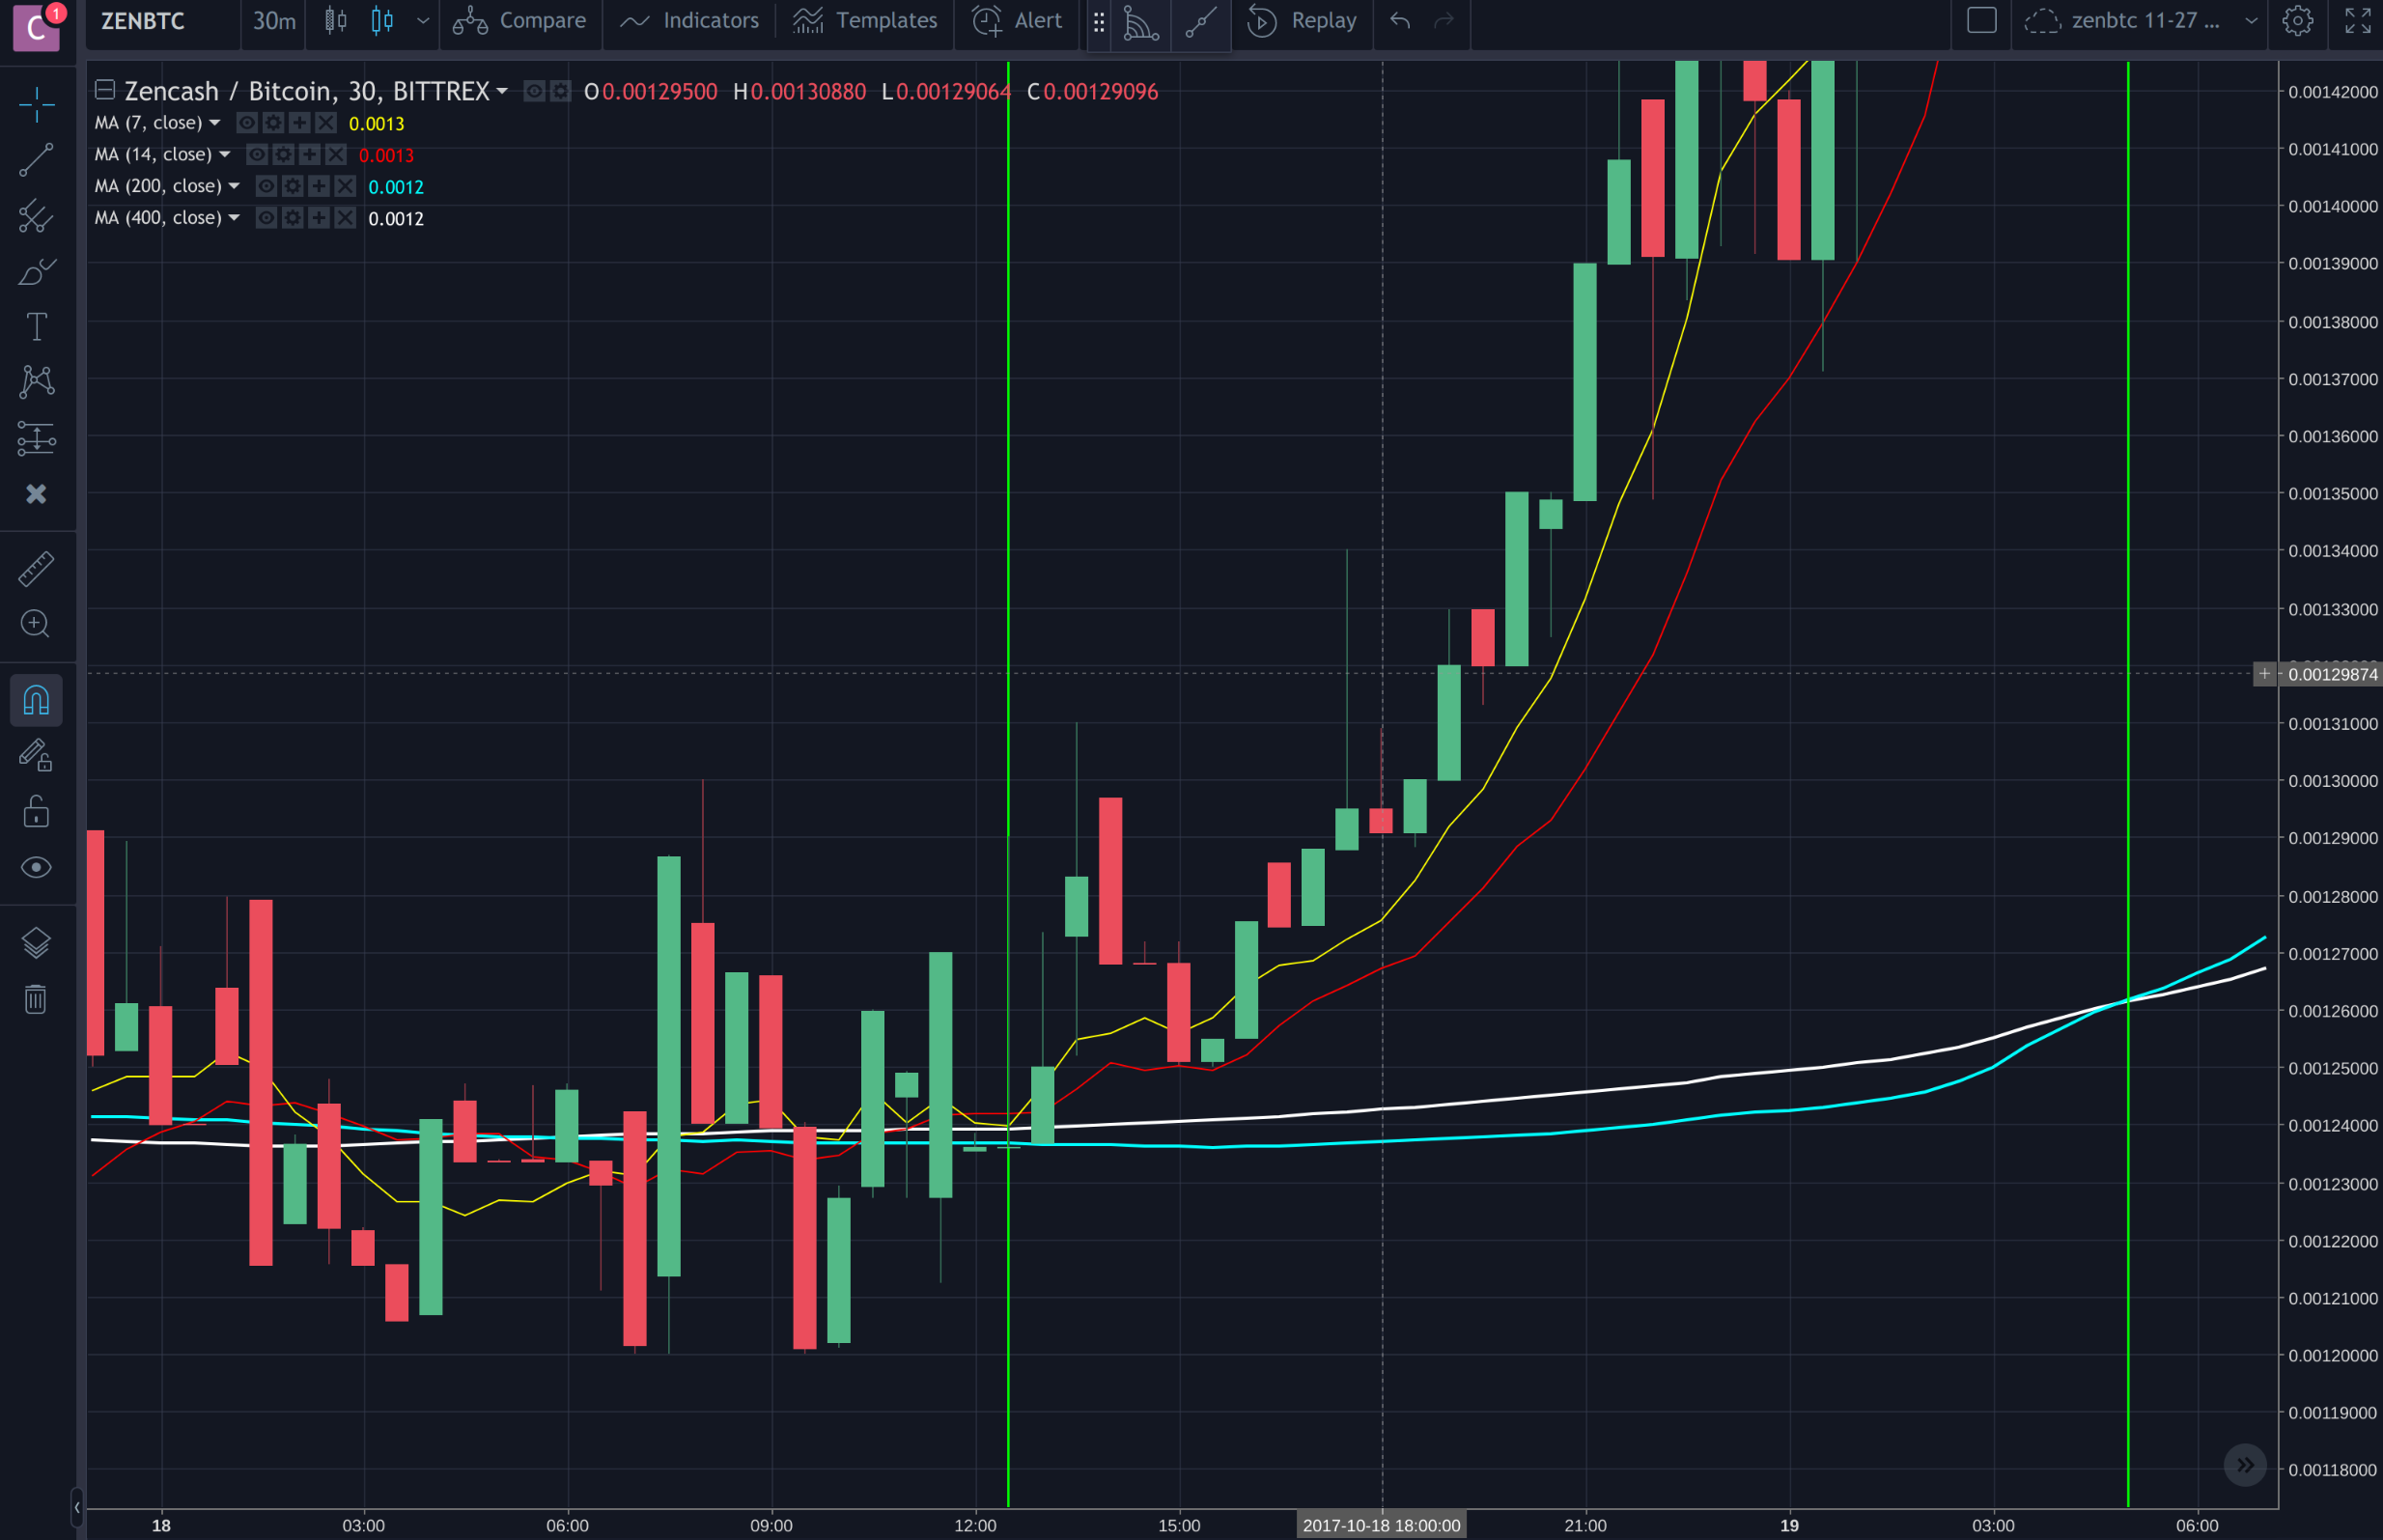
Those are the moments before during and after that "massive" run up. Pay attention to where the 7 crosses the 14 and where the 200 crosses the 400.

This is risky. These indicators tell you about the past. If you think this tells you the future, you're in for a sad, sad day. Just keep that in mind.

Where they cross, the interpretation I have is that on a smaller timescale the upwards momentum has surpassed the heavier timescale. If the momentum is true, then we will see each next timescale follow suit.

![Screenshot 2018-03-04 at 18.44.55.png](https://steemitimages.com/DQmS5SzqsjJAfvR7VLUGaJ9qkaFAHK4dC3mC5VDGDmcXXT7/Screenshot%202018-03-04%20at%2018.44.55.png)

To put that into perspective:

![Screenshot 2018-03-04 at 18.57.33.png](https://steemitimages.com/DQmQ6E1B7BujzffyhrTH3mP25yhNiuC1UewPEGVmvkLJnhr/Screenshot%202018-03-04%20at%2018.57.33.png)

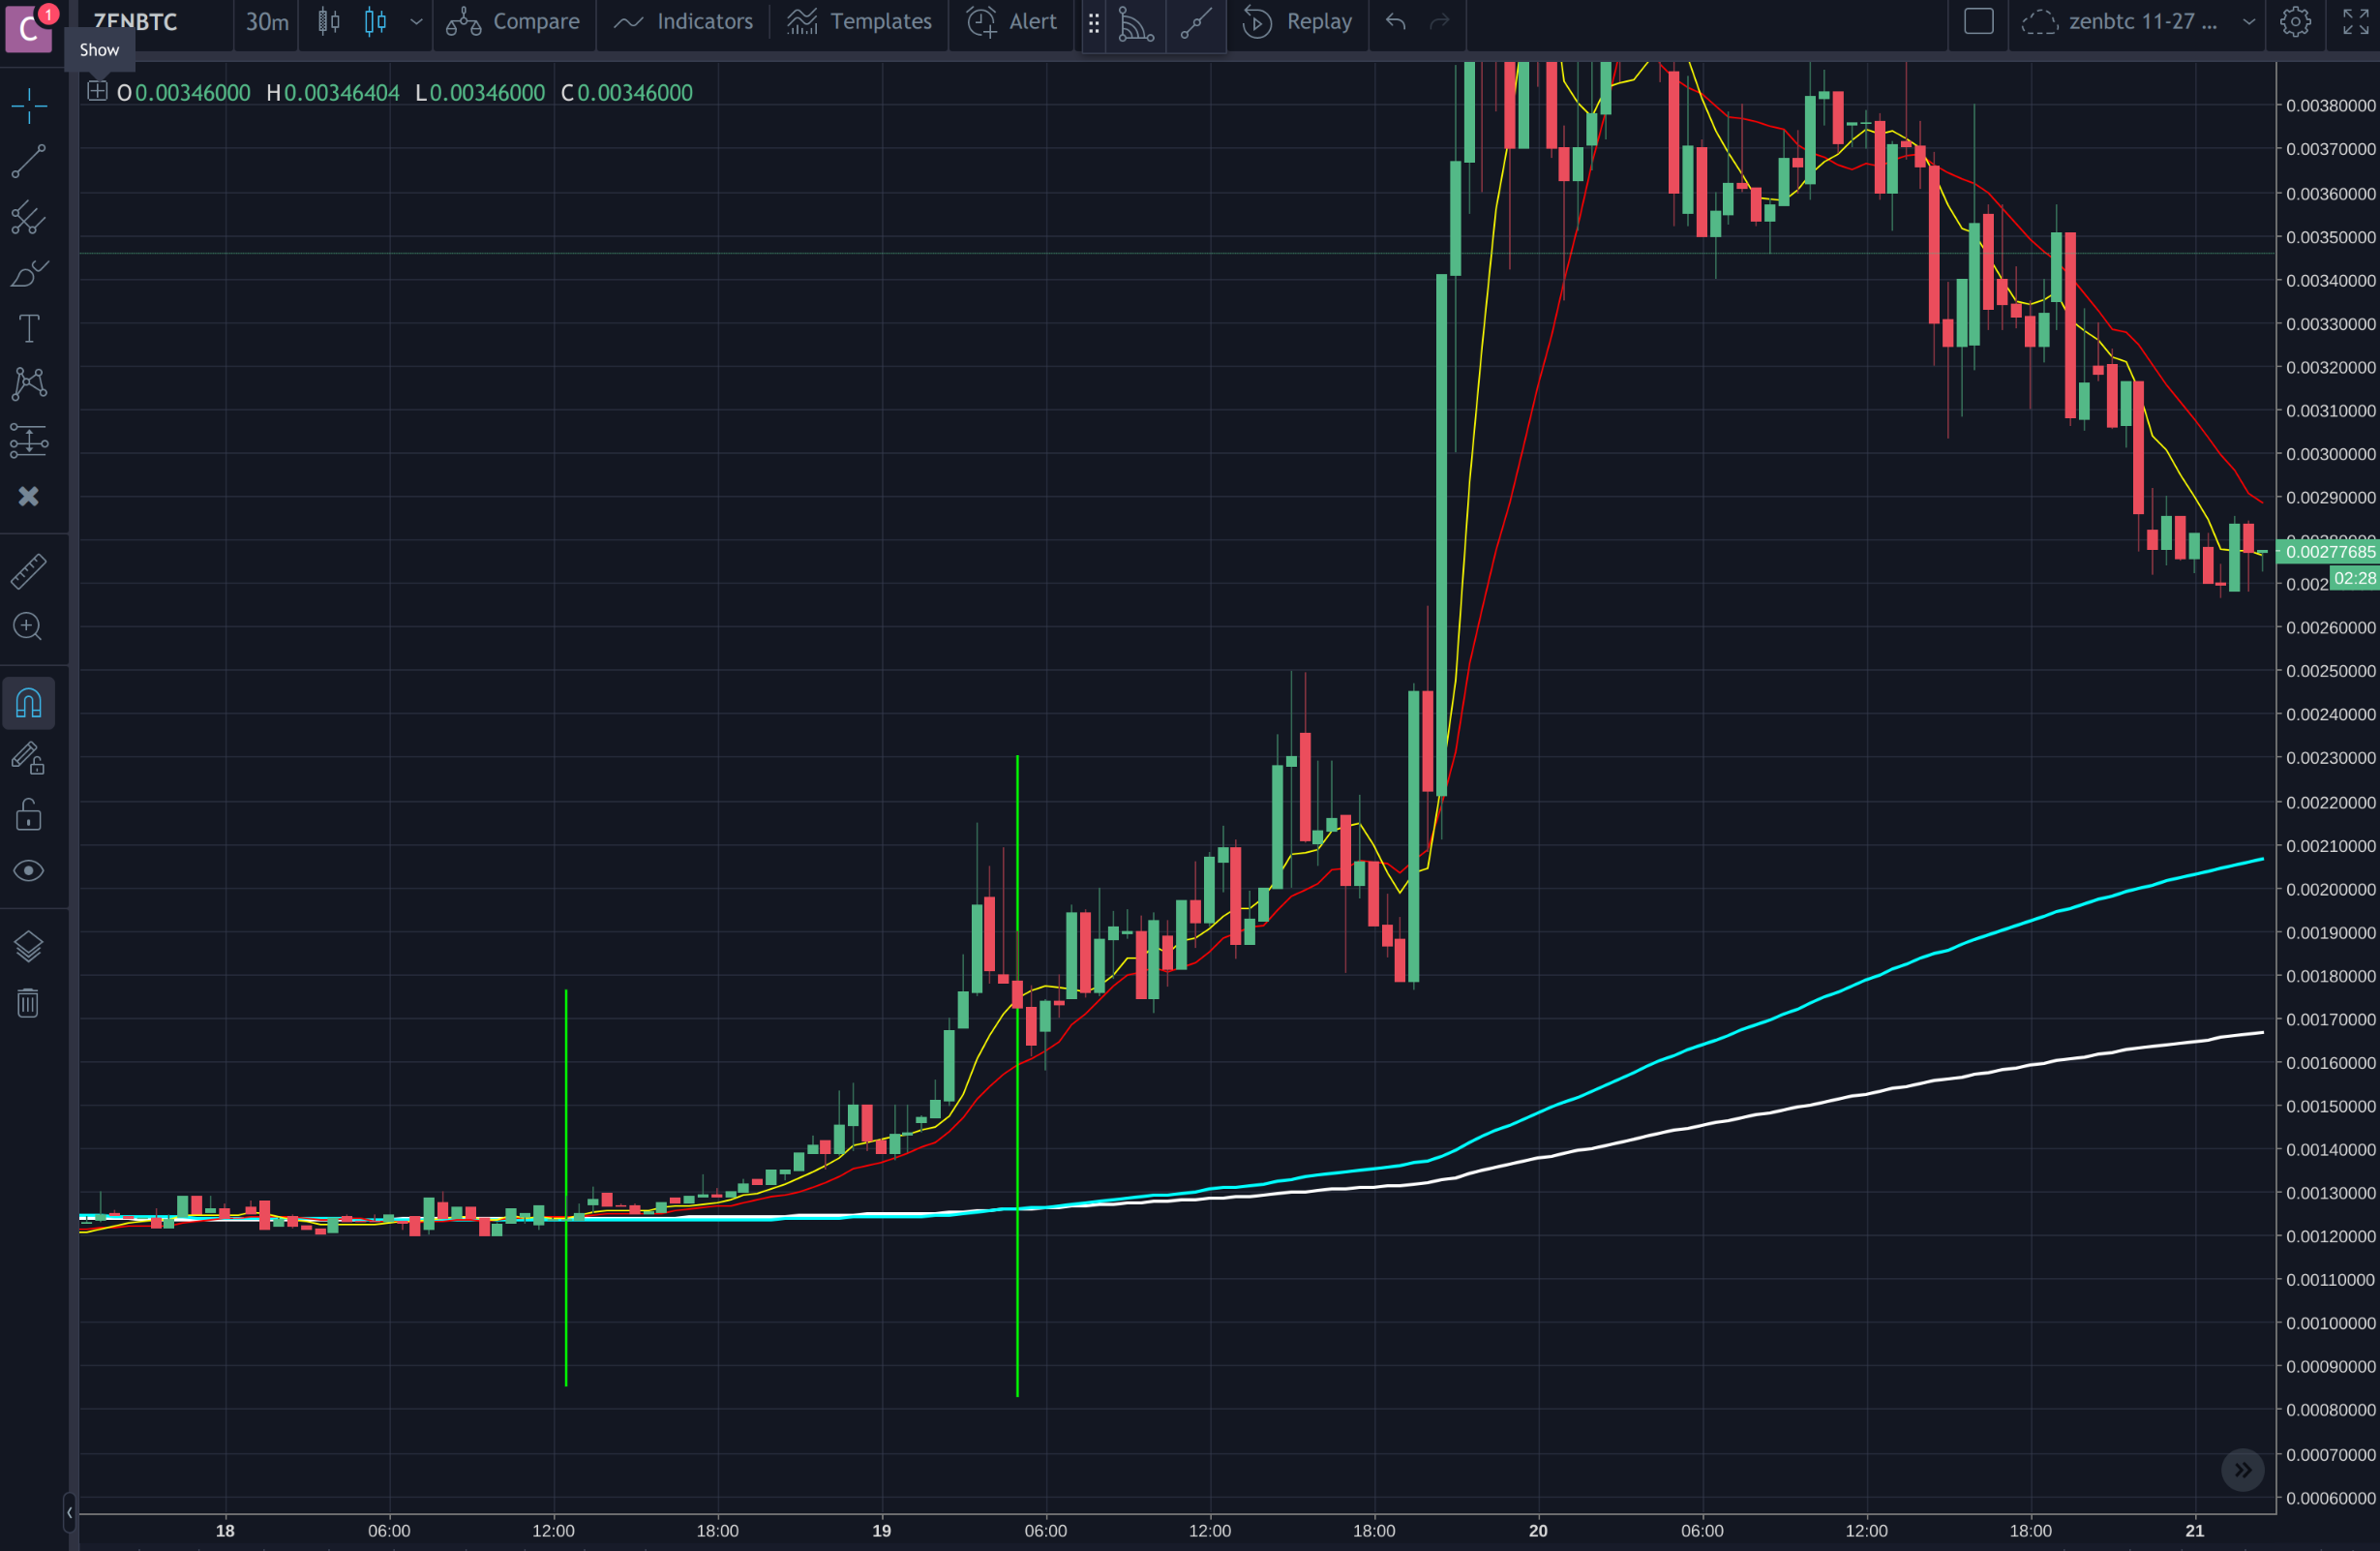
Not so massive when you zoom out! Look towards the MA for an indication of momentum. The light lines will lead the heavy lines, but they will undoubtedly always return to cross the heavy lines. All of these MAs are oscillating with each other.

Once you see those candles jumping up, dont get emotional. Get informed. This Tutorial is getting long so like I wrote at the beginning, this will be a two parter. Expect in the first half of the week. Thanks for tuning in!

For now adios, au revoir, alasmaldik, allah hafes etc.

<center><h1>Part 2: The Price Returns to Long Wicks</h1></center>
👍  , , , , , , , , , , , , ,
properties (23)
authorcloudconnect
permlinktechnical-analysis-tutorial-moving-averages
categorybitcoin
json_metadata{"tags":["bitcoin","zencash","cloudconnect","tutorial","ta"],"image":["https://steemitimages.com/DQmapQG7xhxbgj2sLE5kUgDKsHCZxzmH2uVrodt4duhL2Pc/image.png","https://steemitimages.com/DQmdpV7j8CZ7qENhHsMbRt7DeHwkUoHA6QjA1ecTbrGzABJ/Screenshot%202018-03-04%20at%2017.44.28.png","https://steemitimages.com/DQmVLSTkJhKRKZXTN2PsF2hw7MSBSvd74ASMGVEvWPCZexi/Screenshot%202018-03-04%20at%2017.50.57.png","https://steemitimages.com/DQmUrtJx3wTHfySL988Msq615PaHxXxH5XB8bDJxUbEUBZP/Screenshot%202018-03-04%20at%2017.28.40.png","https://steemitimages.com/DQmT8kfE56zAVAMkhrV3pWPM7PfQu7eMaqWrgbXfksKkWBF/Screenshot%202018-03-04%20at%2018.18.19.png","https://steemitimages.com/DQmaoBn1wfa5cjr8y5D8gC8grmqwUNW7r23TpE4GgLx8CHW/Screenshot%202018-03-04%20at%2017.29.55.png","https://steemitimages.com/DQmSudHqubpipZXfGoVWhQhXRZEhmFAt6xYUv1uTiMUCQZQ/Screenshot%202018-03-04%20at%2018.54.08.png","https://steemitimages.com/DQmS5SzqsjJAfvR7VLUGaJ9qkaFAHK4dC3mC5VDGDmcXXT7/Screenshot%202018-03-04%20at%2018.44.55.png","https://steemitimages.com/DQmQ6E1B7BujzffyhrTH3mP25yhNiuC1UewPEGVmvkLJnhr/Screenshot%202018-03-04%20at%2018.57.33.png"],"links":["http://www.stock-trading-infocentre.com/candle-wicks.html"],"app":"steemit/0.1","format":"markdown"}
created2018-03-05 01:17:39
last_update2018-03-05 01:17:39
depth0
children1
last_payout2018-03-12 01:17:39
cashout_time1969-12-31 23:59:59
total_payout_value13.890 HBD
curator_payout_value3.538 HBD
pending_payout_value0.000 HBD
promoted0.000 HBD
body_length4,905
author_reputation6,428,962,492,377
root_title"Technical Analysis Tutorial-Moving Averages"
beneficiaries[]
max_accepted_payout1,000,000.000 HBD
percent_hbd10,000
post_id42,252,665
net_rshares4,295,275,954,926
author_curate_reward""
vote details (14)
@passive ·
re-cloudconnect-technical-analysis-tutorial-moving-averages-20180305t013952364z
You got a 18.85% upvote from @passive courtesy of @cloudconnect!
properties (22)
authorpassive
permlinkre-cloudconnect-technical-analysis-tutorial-moving-averages-20180305t013952364z
categorybitcoin
json_metadata{"app":"postpromoter/1.8.7"}
created2018-03-05 01:39:51
last_update2018-03-05 01:39:51
depth1
children0
last_payout2018-03-12 01:39:51
cashout_time1969-12-31 23:59:59
total_payout_value0.000 HBD
curator_payout_value0.000 HBD
pending_payout_value0.000 HBD
promoted0.000 HBD
body_length65
author_reputation474,302,221,577
root_title"Technical Analysis Tutorial-Moving Averages"
beneficiaries[]
max_accepted_payout1,000,000.000 HBD
percent_hbd10,000
post_id42,255,909
net_rshares0