Dear Hivers,
Today I'd like to share with you my Long term Technical Analysis of Zilliqa (ZIL).
Before going further with the post, I'd like to clarify that this trade should be executed on a longer time frame which is specified on charts and while it's possible that it executes itself sooner, this is not the main purpose of this trade.
This analysis also has nothing to do with fundamentals of Zilliqa and is strictly a technical analysis based on chart.
Zilliqa is currently sitting at market cap of 7.381 BTC and at a price of 0.00000079 BTC (It actually went up 10% during my writing of this post) which is almost 97% down from its all time high price in terms of BTC in May of 2018 when it was ~ 0.00002400 BTC.
**To get a better picture of this coin, let's look at the 3D candles:**
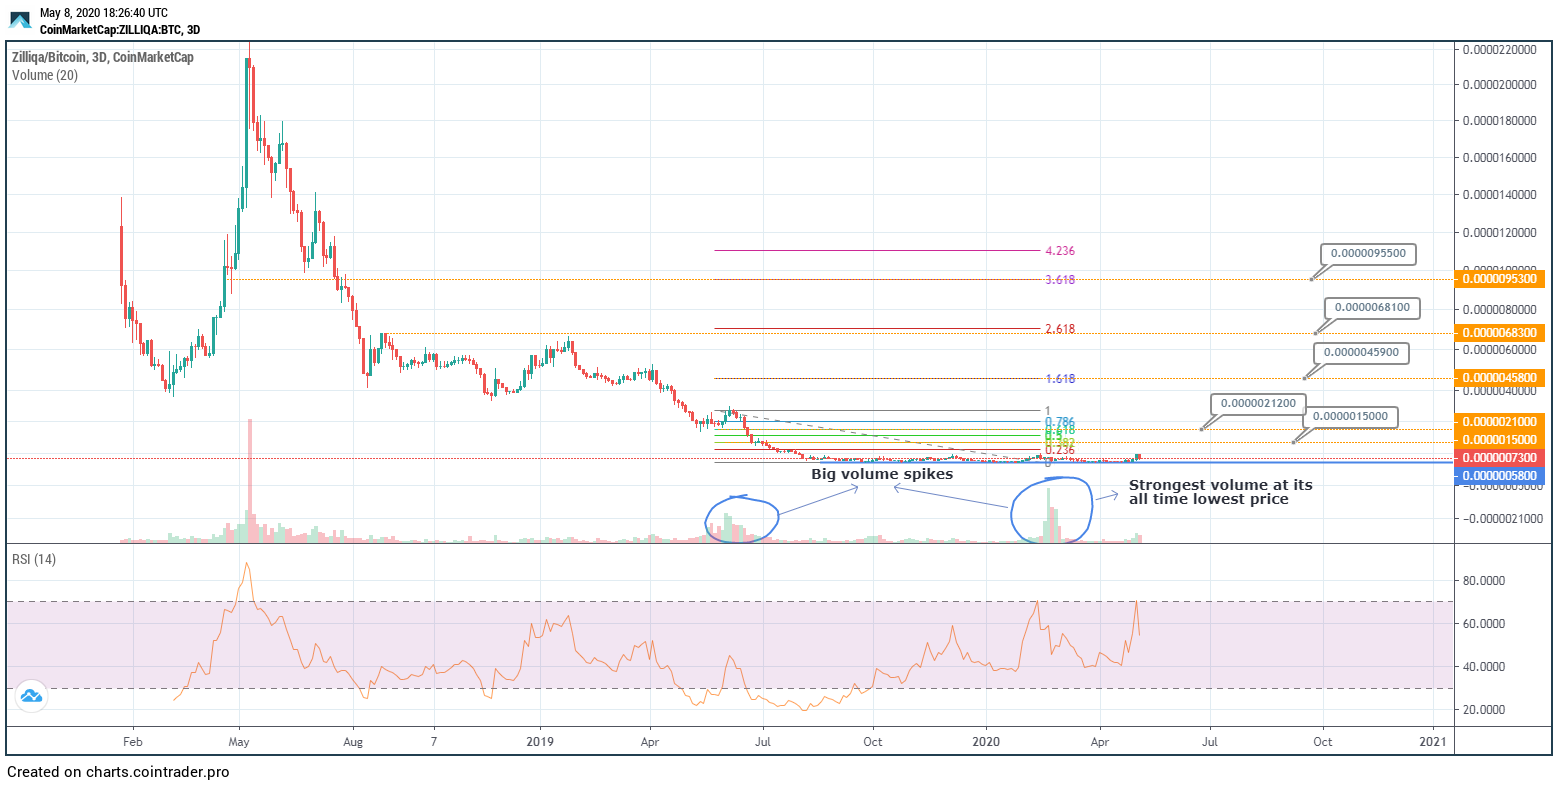
https://charts.cointrader.pro/snapshot/vEHTJ
The most interesting part about this is chart is the three main volumes spikes which can be seen right away: the first happened in May of 2018, second happened in June 2019 and third one was on February of 2020.
As it can be seen on chart right away, the most interesting part is that there seems to be more buying being done when the price is 90%+ lower than when the price was much higher and even approaching it's all time high.
On June 2019, it can be seen that the volume on the all time lowest price in terms of BTC skyrocketed. This indicates strong accumulation behaviors.
Based on all of this, the Fibonacci levels have been placed which mark some targets and resistances which I think will occur late December 2020 / early January 2021.
**Let's zoom in on 1D to see short term pictue more clearly:**
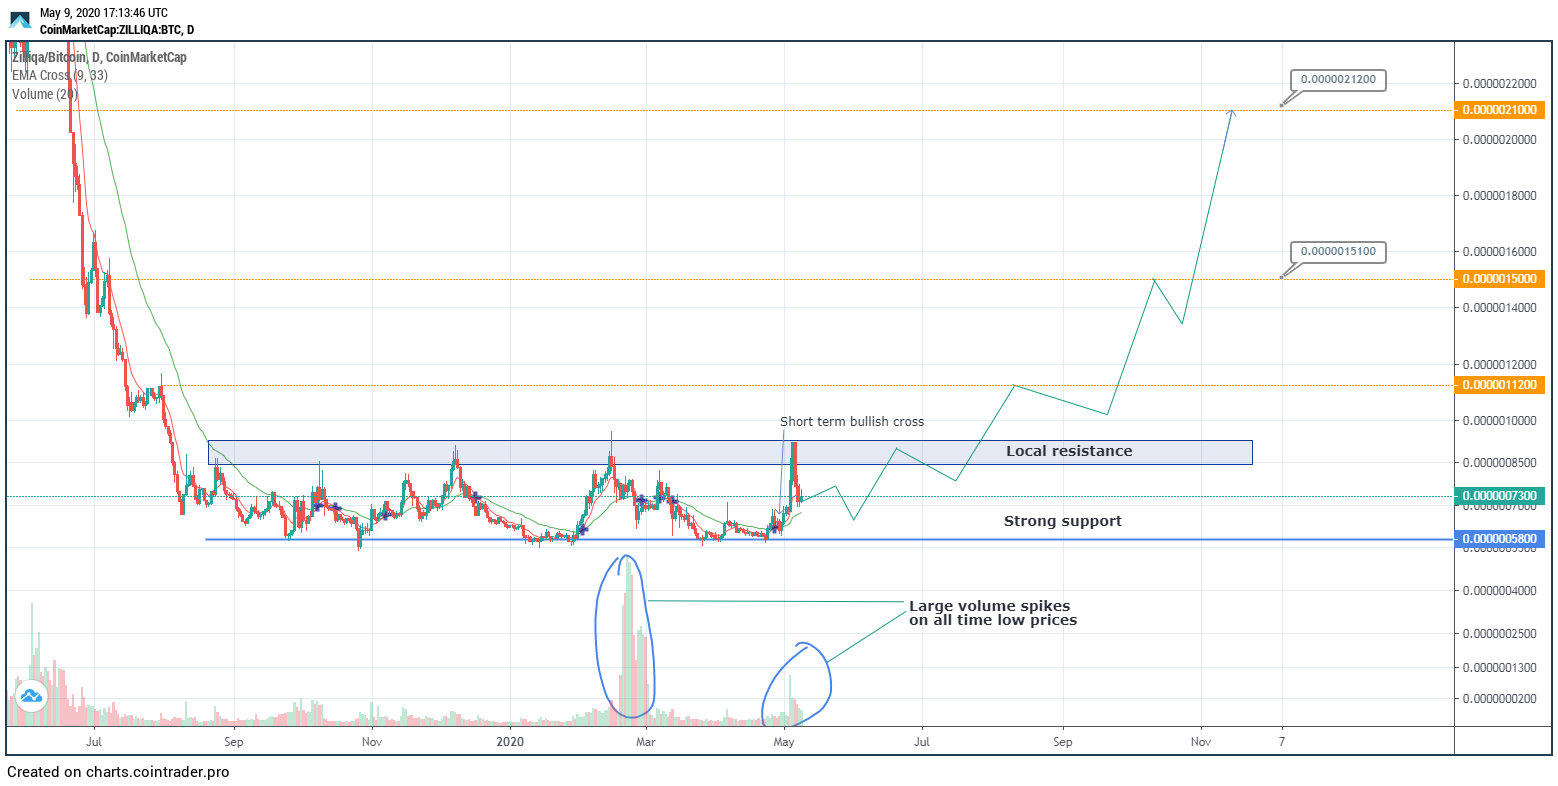
https://charts.cointrader.pro/snapshot/dNuPc
As we can see here ZIL has established a „channel“ since Augut of 2019 with the strong support sitting at 0.00000058 BTC and local resistance at 0.00000084-0.00000095 BTC.
Support is marked with Blue line while resistances are marked with orange lines with exception of local resistance which is marked on the chart. Based on the volume and the price movements, I expect Zilliqa to keep making higher highs and higher lows on smaller time frame.
Here I drawn an example how the price movement might look like even though this could be totally different looking at the growth and corrections, but I drawn it here just to place a basic idea on how this process might look like.
Buying Zilliqa from 0.00000050 to 0.00000073 seems to be a very good risk reward move based on everything written above.
The targets written below are marked with orange line on 3D charts and 1D charts, so the targets are:
* Target 1: 0.00000092 BTC *(Target reached 13. May 2020. - Bittrex)*
* Target 2: 0.00000112 BTC *(Target reached 13. May 2020. - Bittrex)*
* Target 3: 0.00000150 BTC
* Target 4: 0.00000210 BTC
* *Target 5: 0.00000450 BTC
* *Target 6: 0.00000680 BTC
* *Target 7: 0.00000955 BTC
**optional targets*
Please tell me your thoughts on this idea and if you agree with it or not.
Have a nice day and I'll see you all next time!
Kind regards,
~crixus