Today I want to share with my fellow Steemians an online tool which is called [Coggle](https://coggle.it/) With it you can make different data visualizations as for example mind maps or flow charts. Here are some of the visualizations I have done by using this online free tool. Here a visualization of the blockchain technology and all the hype around it from Bitcoin to Ethereum and from Antonopoulos to Vitalik Buterin. 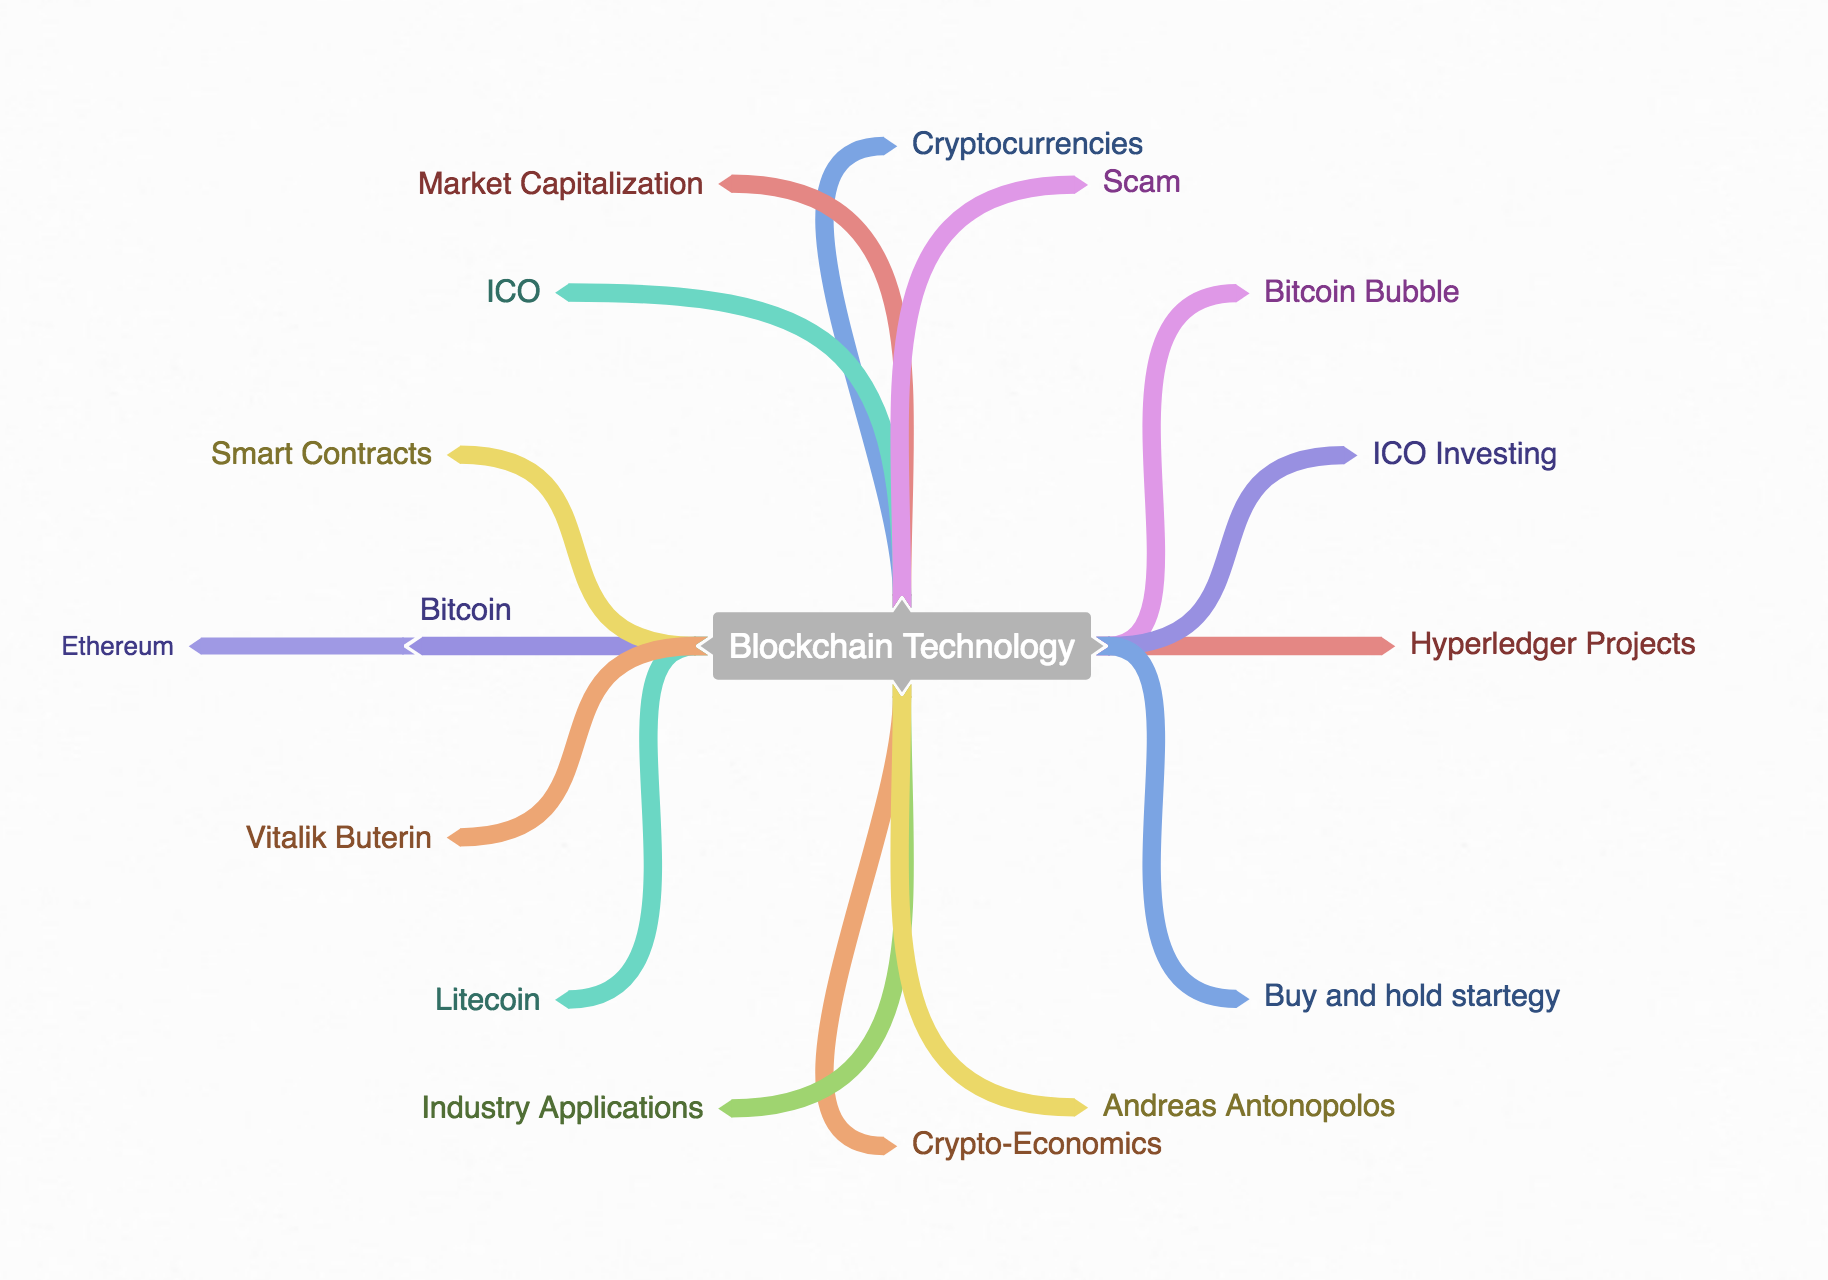 And here a mind map around the SEO (Search Engine Optimization )process. 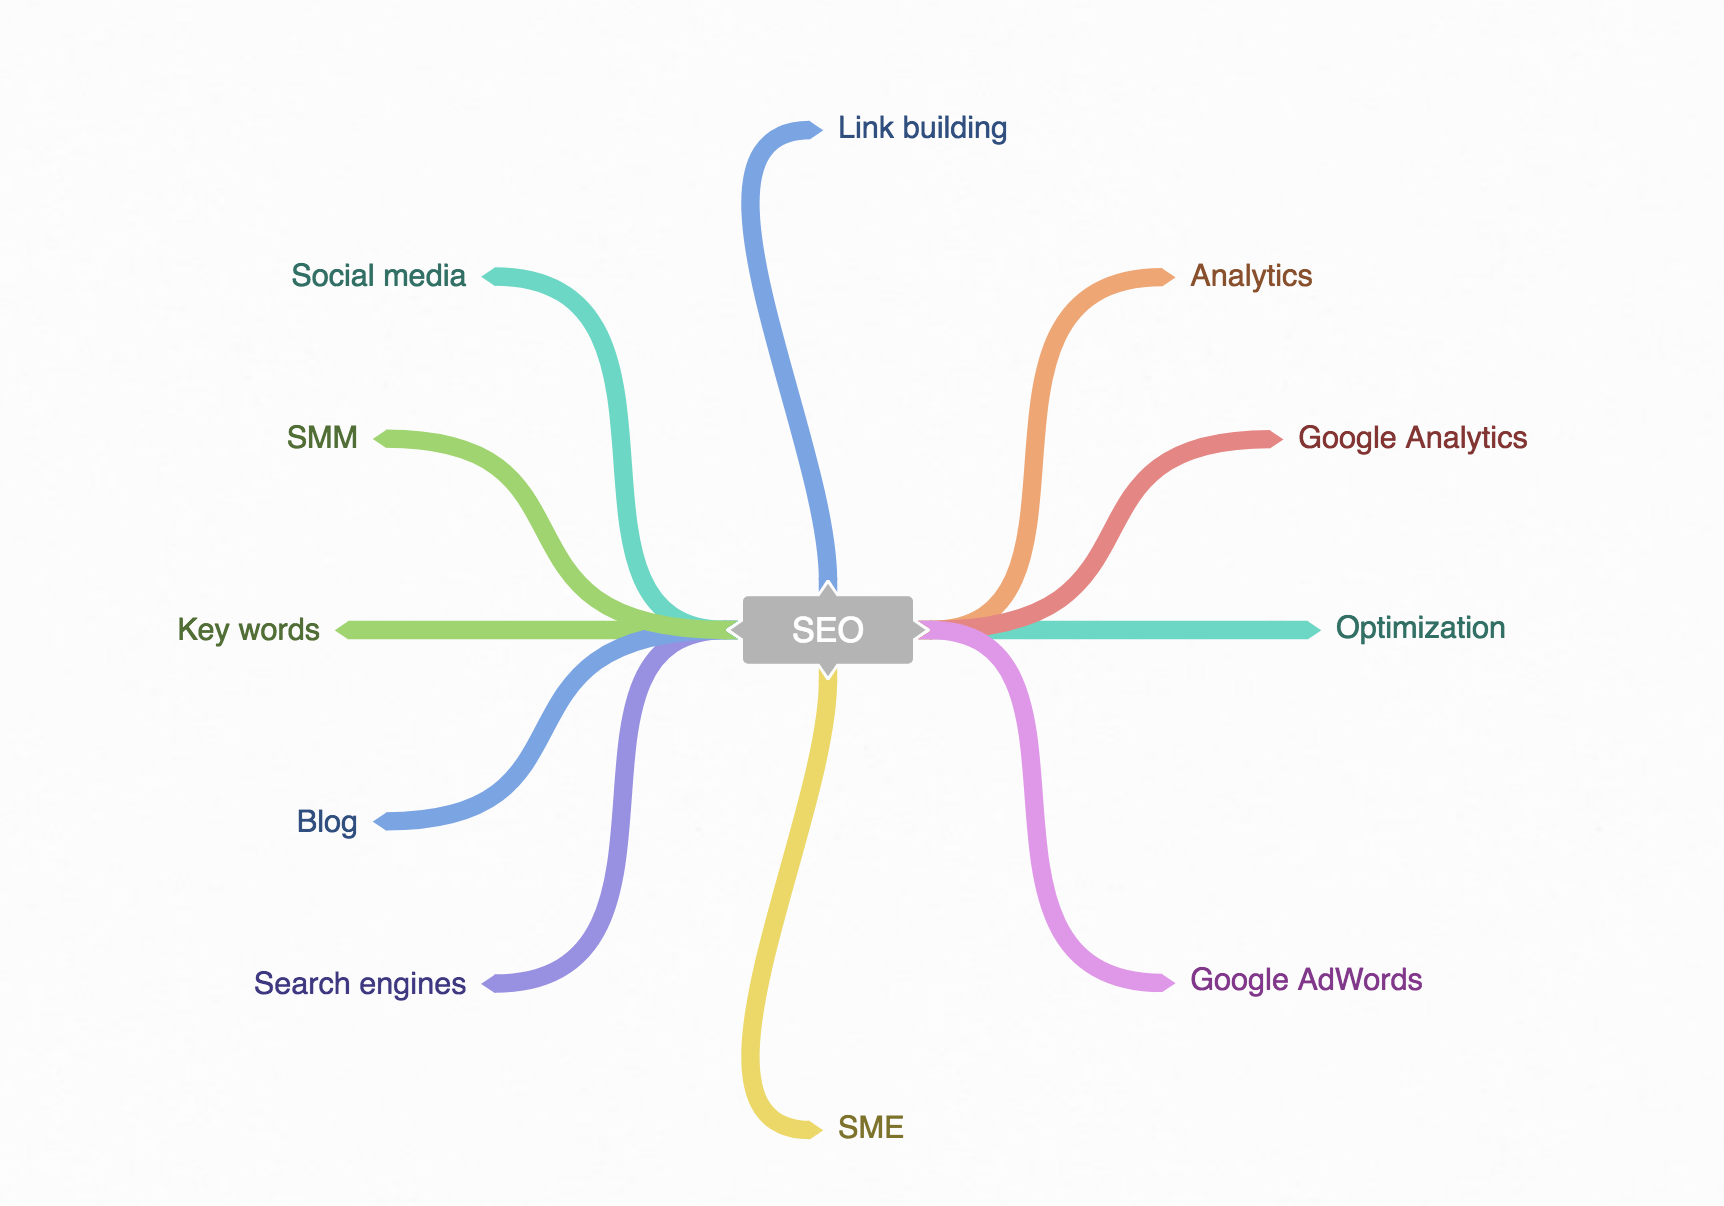 You can also share the link for such mind maps graphics. You can find it here [MindMap about SEO](https://coggle.it/diagram/WkTT-kihWQABHB9N/t/-/162c6e1d23fa924d02a29a738300e342b1b305b862599d08bf33462bad286355) Another interesting type of graphics you can find on Coggle is the following flow chart. 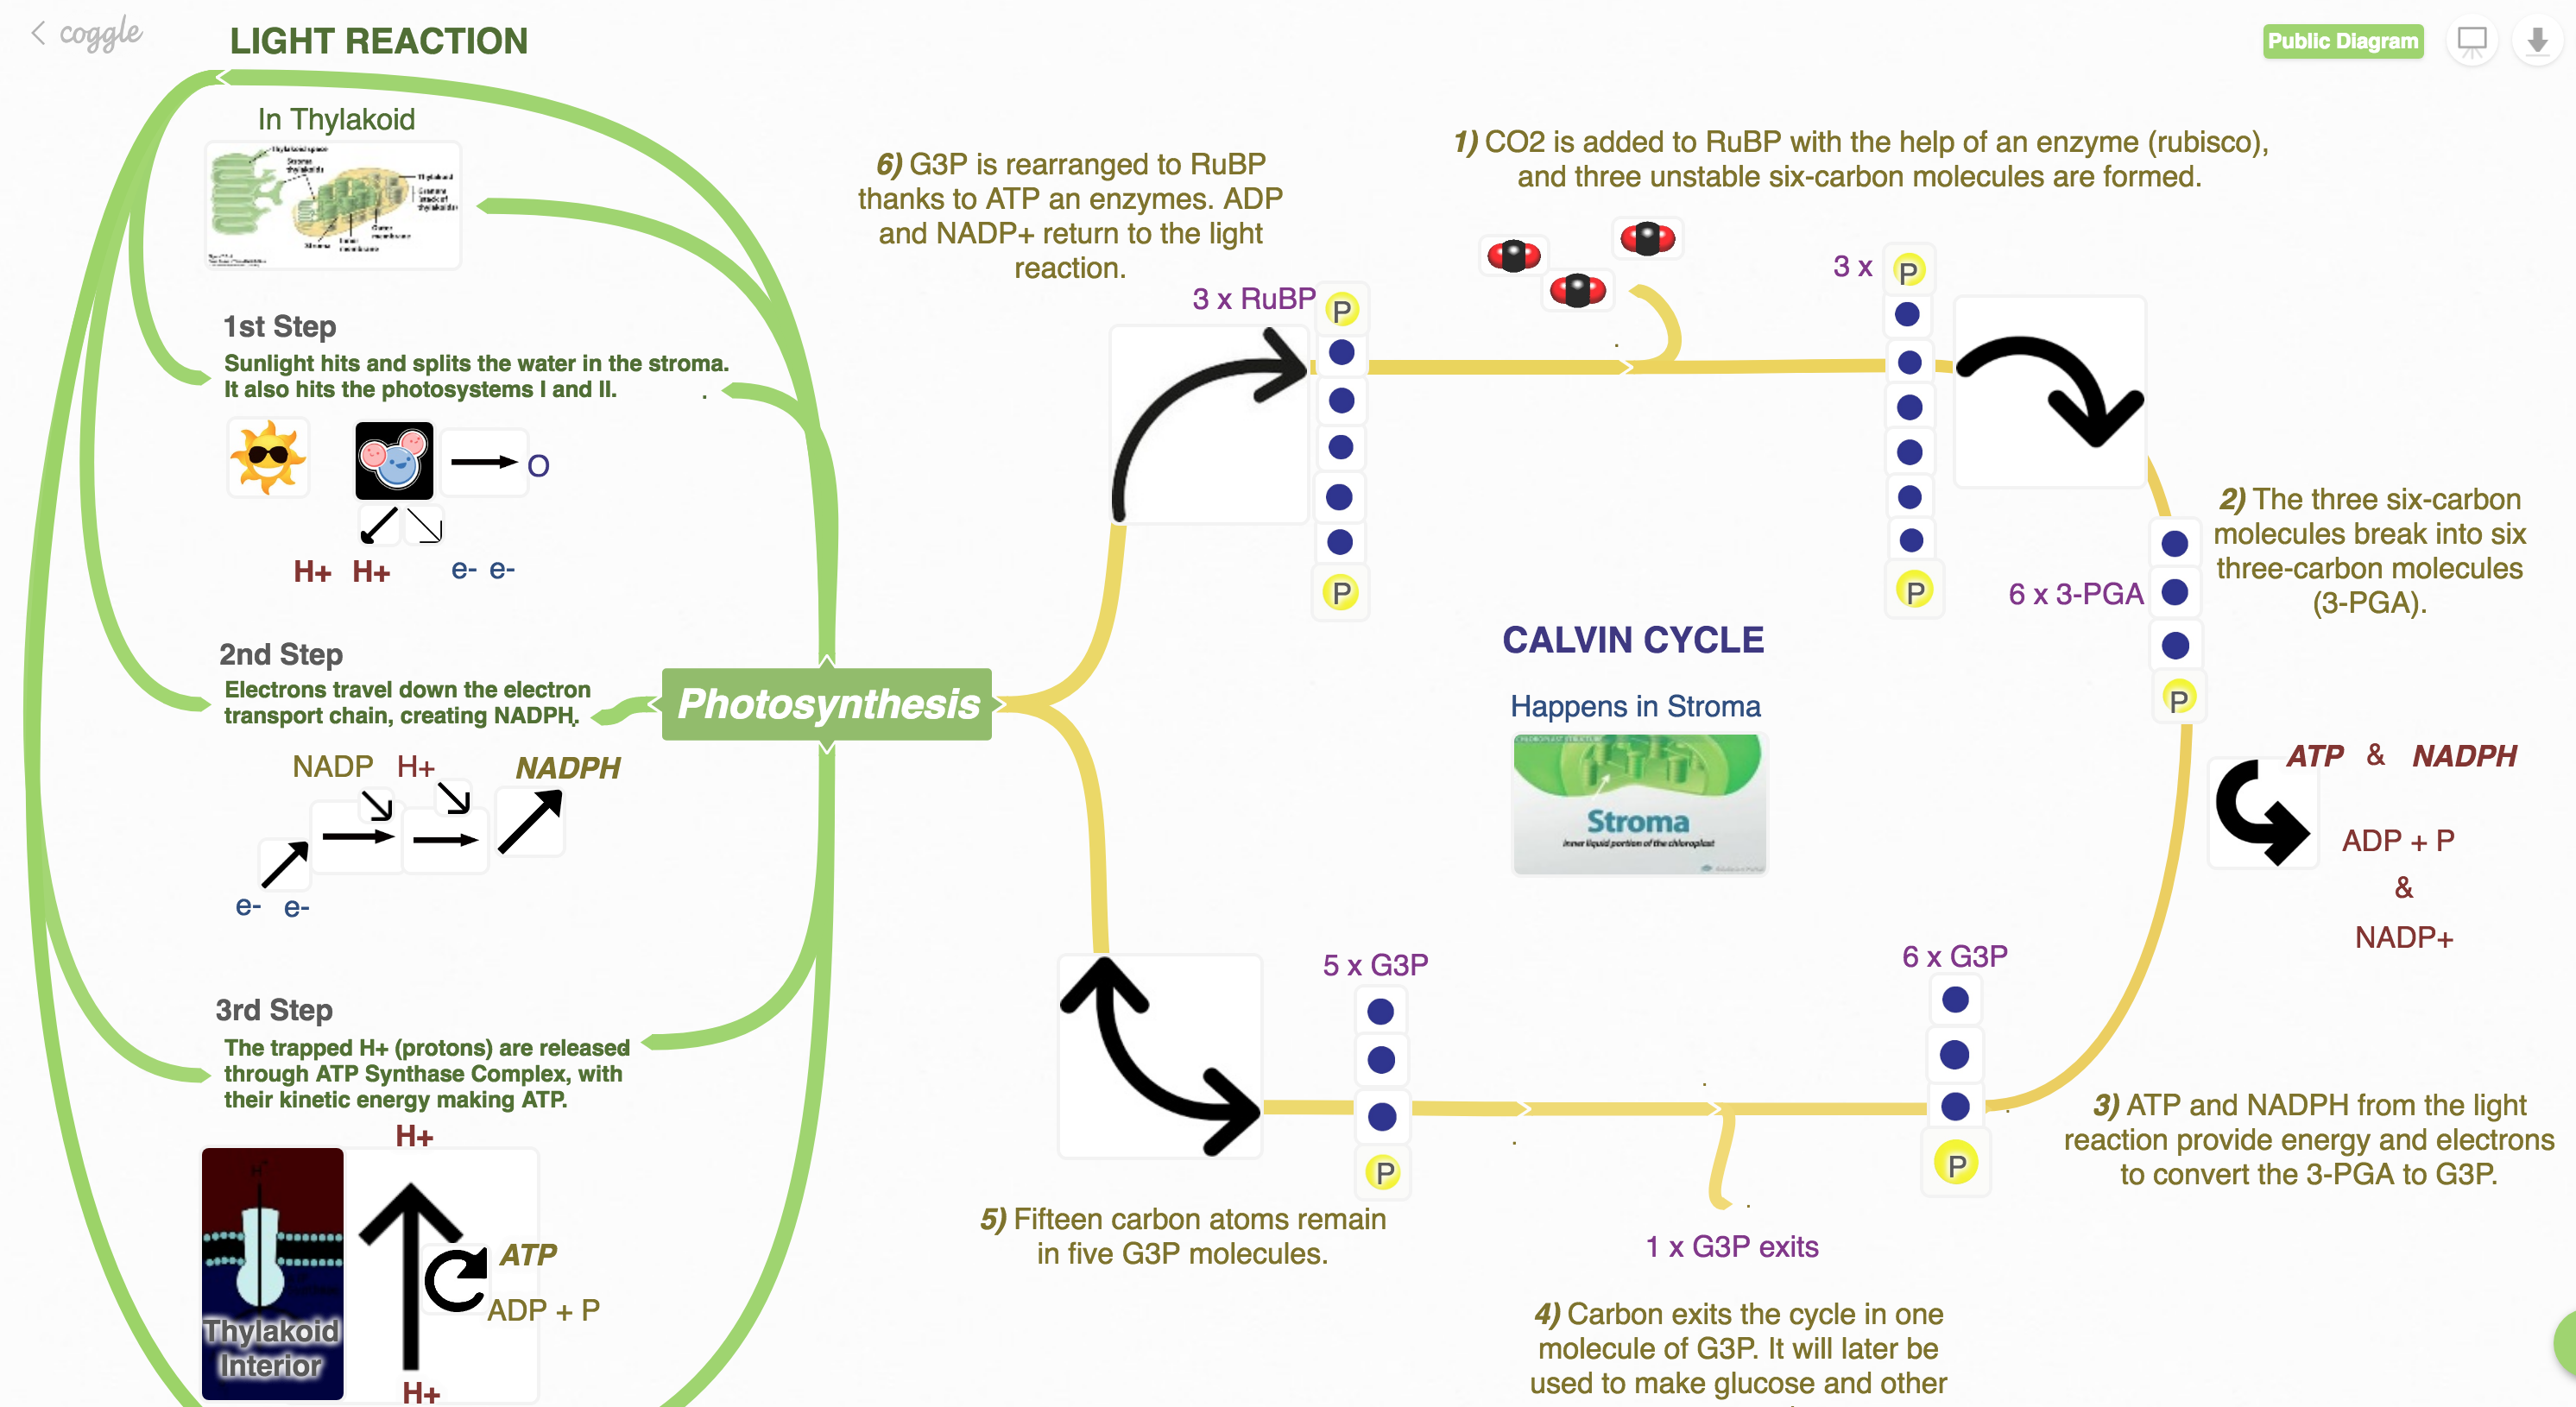 The premium version of Coggle gives you even more features. This is for today! Enjoy :-)
| author | datatreemap |
|---|---|
| permlink | a-nice-took-for-making-visualization-of-data-as-mind-maps-or-flow-charts-graphics |
| category | mind |
| json_metadata | {"tags":["mind","map","visualization","graphics","art"],"image":["https://steemitimages.com/DQmbd3F3RmWuCRkYnptDaxxxZ1ubJRuxazGeKoAimj9EBHF/Schermata%202017-12-28%20alle%2012.20.34.png","https://steemitimages.com/DQmf9sR6uB2ZVwo41mM9K7HXpii3otPv4DjFJnj9PyJFChn/Schermata%202017-12-28%20alle%2012.24.30.png","https://steemitimages.com/DQmSvM3S8FhnSZgTjh6eixUMui5GJ1FjNvPpzrzCksVQLXi/Schermata%202017-12-28%20alle%2012.31.04.png"],"links":["https://coggle.it/","https://coggle.it/diagram/WkTT-kihWQABHB9N/t/-/162c6e1d23fa924d02a29a738300e342b1b305b862599d08bf33462bad286355"],"app":"steemit/0.1","format":"markdown"} |
| created | 2017-12-28 11:34:06 |
| last_update | 2017-12-28 11:34:06 |
| depth | 0 |
| children | 3 |
| last_payout | 2018-01-04 11:34:06 |
| cashout_time | 1969-12-31 23:59:59 |
| total_payout_value | 1.102 HBD |
| curator_payout_value | 0.160 HBD |
| pending_payout_value | 0.000 HBD |
| promoted | 0.000 HBD |
| body_length | 1,392 |
| author_reputation | 1,549,527,349,404 |
| root_title | "A nice took for making visualization of data as mind maps or flow charts graphics." |
| beneficiaries | [] |
| max_accepted_payout | 1,000,000.000 HBD |
| percent_hbd | 10,000 |
| post_id | 25,673,411 |
| net_rshares | 109,469,898,999 |
| author_curate_reward | "" |
| voter | weight | wgt% | rshares | pct | time |
|---|---|---|---|---|---|
| hr1 | 0 | 50,629,613,915 | 0.05% | ||
| bunny | 0 | 50,800,675 | 100% | ||
| bue | 0 | 27,587,440,835 | 100% | ||
| goldie | 0 | 1,330,472,113 | 100% | ||
| feriharmansyah | 0 | 1,251,836,509 | 100% | ||
| mgogel | 0 | 0 | 100% | ||
| dmiton | 0 | 54,722,386 | 1% | ||
| alketcecaj | 0 | 5,815,067,315 | 100% | ||
| datatreemap | 0 | 22,548,715,430 | 100% | ||
| originalworks2 | 0 | 201,229,821 | 1% | ||
| nevertolate | 0 | 0 | 100% | ||
| datavizcat | 0 | 0 | 100% |
@originalworks
| author | datatreemap |
|---|---|
| permlink | re-datatreemap-a-nice-took-for-making-visualization-of-data-as-mind-maps-or-flow-charts-graphics-20171228t121109798z |
| category | mind |
| json_metadata | {"tags":["mind"],"users":["originalworks"],"app":"steemit/0.1"} |
| created | 2017-12-28 12:11:09 |
| last_update | 2017-12-28 12:11:09 |
| depth | 1 |
| children | 2 |
| last_payout | 2018-01-04 12:11:09 |
| cashout_time | 1969-12-31 23:59:59 |
| total_payout_value | 0.000 HBD |
| curator_payout_value | 0.000 HBD |
| pending_payout_value | 0.000 HBD |
| promoted | 0.000 HBD |
| body_length | 14 |
| author_reputation | 1,549,527,349,404 |
| root_title | "A nice took for making visualization of data as mind maps or flow charts graphics." |
| beneficiaries | [] |
| max_accepted_payout | 1,000,000.000 HBD |
| percent_hbd | 10,000 |
| post_id | 25,678,271 |
| net_rshares | 1,273,670,867 |
| author_curate_reward | "" |
| voter | weight | wgt% | rshares | pct | time |
|---|---|---|---|---|---|
| feriharmansyah | 0 | 1,273,670,867 | 100% |
Good post folow me @feriharmansyah 😊
| author | feriharmansyah |
|---|---|
| permlink | re-datatreemap-re-datatreemap-a-nice-took-for-making-visualization-of-data-as-mind-maps-or-flow-charts-graphics-20171228t121621972z |
| category | mind |
| json_metadata | {"tags":["mind"],"users":["feriharmansyah"],"app":"steemit/0.1"} |
| created | 2017-12-28 12:25:12 |
| last_update | 2017-12-28 12:25:12 |
| depth | 2 |
| children | 0 |
| last_payout | 2018-01-04 12:25:12 |
| cashout_time | 1969-12-31 23:59:59 |
| total_payout_value | 0.000 HBD |
| curator_payout_value | 0.000 HBD |
| pending_payout_value | 0.000 HBD |
| promoted | 0.000 HBD |
| body_length | 36 |
| author_reputation | 1,548,630,285 |
| root_title | "A nice took for making visualization of data as mind maps or flow charts graphics." |
| beneficiaries | [] |
| max_accepted_payout | 1,000,000.000 HBD |
| percent_hbd | 10,000 |
| post_id | 25,680,143 |
| net_rshares | 0 |
The @OriginalWorks bot has determined this post by @datatreemap to be original material and upvoted it! <center></center> To call @OriginalWorks, simply reply to any post with @originalworks or !originalworks in your message!
| author | originalworks2 |
|---|---|
| permlink | re-re-datatreemap-a-nice-took-for-making-visualization-of-data-as-mind-maps-or-flow-charts-graphics-20171228t121109798z-20171228t121242 |
| category | mind |
| json_metadata | "{"app": "pysteem/0.5.4"}" |
| created | 2017-12-28 12:12:42 |
| last_update | 2017-12-28 12:12:42 |
| depth | 2 |
| children | 0 |
| last_payout | 2018-01-04 12:12:42 |
| cashout_time | 1969-12-31 23:59:59 |
| total_payout_value | 0.000 HBD |
| curator_payout_value | 0.000 HBD |
| pending_payout_value | 0.000 HBD |
| promoted | 0.000 HBD |
| body_length | 347 |
| author_reputation | 18,744,736,007 |
| root_title | "A nice took for making visualization of data as mind maps or flow charts graphics." |
| beneficiaries | [] |
| max_accepted_payout | 1,000,000.000 HBD |
| percent_hbd | 10,000 |
| post_id | 25,678,485 |
| net_rshares | 0 |