"""
제 개인적 목표는
1. Object-Oriented Programming과 친해지기
2. Github와 친해지기 입니다.
이 목표에 닿기 위해 일단 제가 나름 좀 아는 Python, 그 중에서도 _**Numpy**_와 _**Matplotlib**_로부터 시작하려 합니다.
"""

## 03. Axes Setup: Text, Label, and Annotation
그림의 x축 혹은 y축의 Label이름표와 임의의 장소에 Text표시, 그리고 Annotation에 대하여 다뤄보겠습니다.
### 03.1. Axes Label
x축과 y축의 Label이름표를 다는 명령어는
[Axes.set_xlabel(xlabel, fontdict=None, labelpad=None, **kwargs)](https://matplotlib.org/api/_as_gen/matplotlib.axes.Axes.set_xlabel.html#matplotlib.axes.Axes.set_xlabel)
[Axes.set_ylabel(ylabel, fontdict=None, labelpad=None, **kwargs)](https://matplotlib.org/api/_as_gen/matplotlib.axes.Axes.set_ylabel.html#matplotlib.axes.Axes.set_ylabel)
가 있습니다.
사용법은 간단하며, 일단 예제 코드를 보시겠습니다.
```
import sys
import numpy as np
import matplotlib.pyplot as plt
###--- Synthesizing data to be plotted ---###
x = np.arange(5) # Same as x = np.array(range(5))
y = x**2 # Basically item-wise calculation for numpy arrays
###--- Plotting Start ---###
##-- Page Setup --##
fig = plt.figure() # Define "figure" instance
fig.set_size_inches(6,4.5) # Physical page size in inches, (lx,ly)
suptit="Label, Text, and Annotation"
fig.suptitle(suptit,fontsize=15) # Title for the page
fig.subplots_adjust(left=0.12,right=0.95,bottom=0.15,top=0.91)
##-- Plotting for axis1 --##
ax1 = fig.add_subplot(1,1,1) # subplot(# of rows, # of columns, indicater)
ax1.plot(x,y) # plotting line graph
##-- Label, Text, and Annotation --##
ax1.set_xlabel('Left\nTop',ha='left',va='top',x=0.,fontsize=12)
ax1.set_ylabel('Left\nTop',ha='left',va='top',y=0.,fontsize=12)
#ax1.set_xlabel('Center\nCenter',ha='center',va='center',x=0.5,fontsize=12)
#ax1.set_ylabel('Center\nCenter',ha='center',va='center',y=0.5,fontsize=12)
#ax1.set_xlabel('Right\nBottom',ha='right',va='bottom',x=1.,fontsize=12)
#ax1.set_ylabel('Right\nBottom',ha='right',va='bottom',y=1.,fontsize=12)
ax1.text(0.5,15.,'Normal Text')
pos1=ax1.get_position().bounds ##<= (left,bottom,width,height)
plt.figtext(pos1[0]+pos1[2]*0.05,pos1[1]+pos1[3]*0.85,'Text in Pink Box',backgroundcolor='pink',color='k',fontsize=12)
ax1.annotate(r'$y=x^2$', xy=(3., 9.), xycoords='data',
xytext=(3.5,4.), textcoords='data', size=12,
arrowprops=dict(arrowstyle="->", connectionstyle="arc3,rad=0.5"),
)
##-- Seeing or Saving Pic --##
#plt.show() #- If want to see on screen -#
outdir = "./"
outfnm = outdir+"03_axes_setup.textlabel1a.png" # File format is decided by the file name, eg. png here
#fig.savefig(outfnm,dpi=100,facecolor='0.9',bbox_inches='tight') # dpi: pixels per inch
fig.savefig(outfnm,dpi=100,facecolor='0.9') # dpi: pixels per inch
sys.exit()
```
<br>
위 코드에서 Label의 정렬 방법을 각각 세 가지로 설정하였을 때 아래 그림과 같이 정렬이 됩니다.
x축에서는 "Center & Top"이, y축에서는 "Center & Bottom"이 적당해보이는군요. 여기서 "Top"과 "Bottom"은 각각 기준점에 글자의 상단 그리고 하단이 위치한다는 의미입니다.
만약 y축 이름표를 오른쪽에 붙이고 싶으면 어떻게 할까요?
위 예제 코드의 "ax1.set_ylabel(..." 부분을 다음과 같이 고치면 됩니다.
```
ax1.set_ylabel('Y Label on Right',fontsize=12,rotation=-90,labelpad=15)
ax1.yaxis.set_label_position('right')
```
더하여, 사실 그림 좌우 여백도 좀 손을 봤습니다. (```fig.subplots_adjust(left=0.07,right=0.9,bottom=0.15,top=0.91)```)
그럼 아래와 같은 그림이 나옵니다.
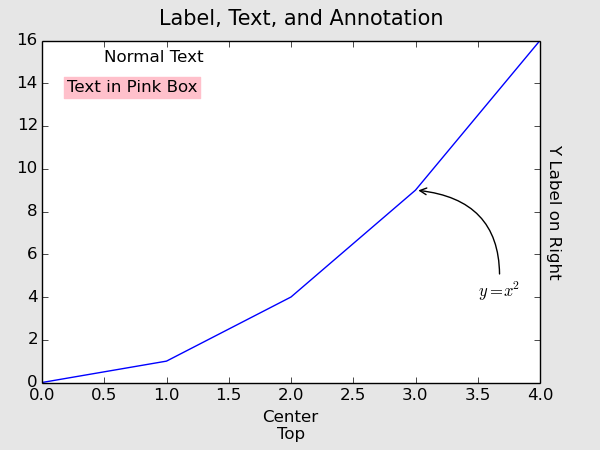
그림 오른쪽에 표시하는 핵심은 ```ax1.yaxis.set_label_position('right')```인데, ```ax1.set_ylabel()```에도 약간의 수정이 가해졌습니다. 오른쪽으로 갔으니 글자를 돌려야 해서 ```rotation=-90```이 들어갔고 (이게 없으면 기본은 "rotation=90"입니다.), 그렇게 돌렸더니 축에 너무 붙어서 ```lablepad=12```로 여백을 줬습니다. y축 이름표를 오른쪽으로 보내면 "va='Top' or 'Bottom'"이 작동을 안합니다. 그래서 "labelpad"를 이용하여 위치를 조정해주어야 합니다. "labelpad"의 숫자는 픽셀 포인트를 의미합니다.
### 03.2. Text and Figtext
Text는 Axes에 속한 함수입니다. 따라서,
```ax1.test(0.5,15.,'Normal Text')```
이렇게 실행됩니다. Axes에 속한 함수들은 대부분 위치를 데이타 기준으로 잡습니다. 즉, 위 예는 x=0.5, y=15인 좌표를 기준으로 Text를 표시한다는 뜻입니다. 위 그림을 자세히 보면, ```ha="left", va="bottom"```이 기본으로 설정되었음을 알 수 있습니다.
Figtext는 plt(=matplotlib.pyplot)레벨의 함수입니다. Figtext의 가장 큰 특징은 글 테두리 상자를 자동으로 생성한다는 점입니다. 위 예에서는 상자의 색깔도 지정해보았습니다. 색 이름은 HTML에 사용되는 색 이름은 거의 다 바로 쓸 수 있습니다.
```
pos1=ax1.get_position().bounds ##<= (left,bottom,width,height)
plt.figtext(pos1[0]+pos1[2]*0.05,pos1[1]+pos1[3]*0.85,'Text in Pink Box',backgroundcolor='pink',color='k',fontsize=12)
```
Figtext는 plt의 함수이기 때문에, Axes와 상관없이 종이 전체의 비율값에 글자를 쓰고 테두리 상자를 그립니다. 그림 상에서 임의의 위치를 비율로 정확히 집어내기는 어렵기 때문에, 여기서는 일단 정의된 Axes의 모서리 값을 불러옵니다. 그 후 그 모서리를 기준으로 적당한 비율을 움직여 위치를 잡아보았습니다.
### 03.3. Annotation
Matplotlib에서 제공되는 함수 중에 이렇게 화살표를 이용하여 그림에 주석을 달 수 있는 도구가 있습니다.
```
ax1.annotate(r'$y=x^2$', xy=(3., 9.), xycoords='data',
xytext=(3.5,4.), textcoords='data', size=12,
arrowprops=dict(arrowstyle="->", connectionstyle="arc3,rad=0.5"),
)
```
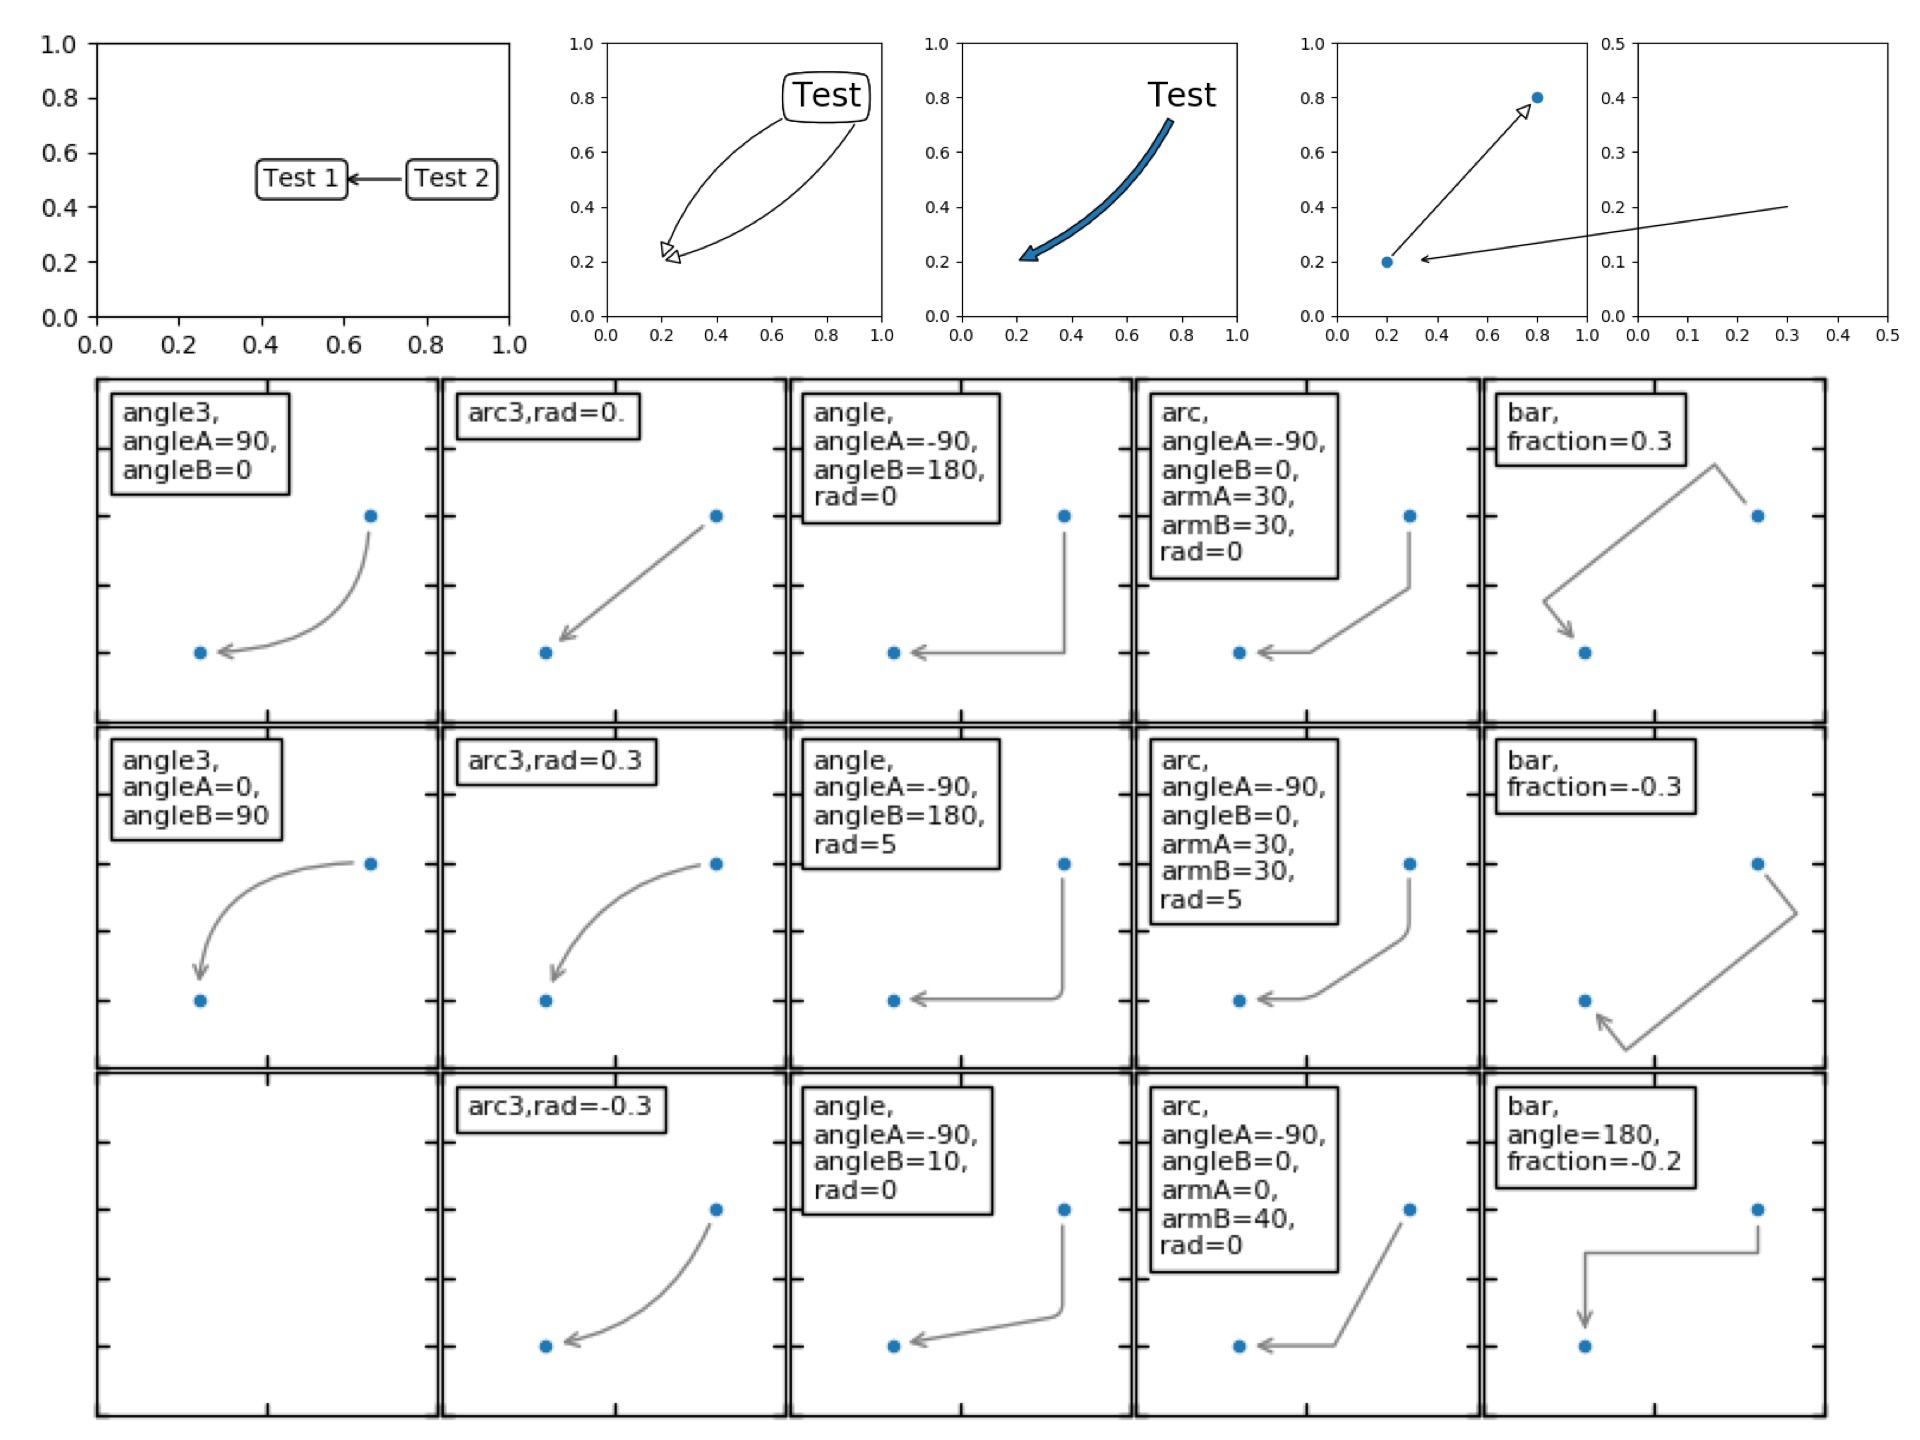
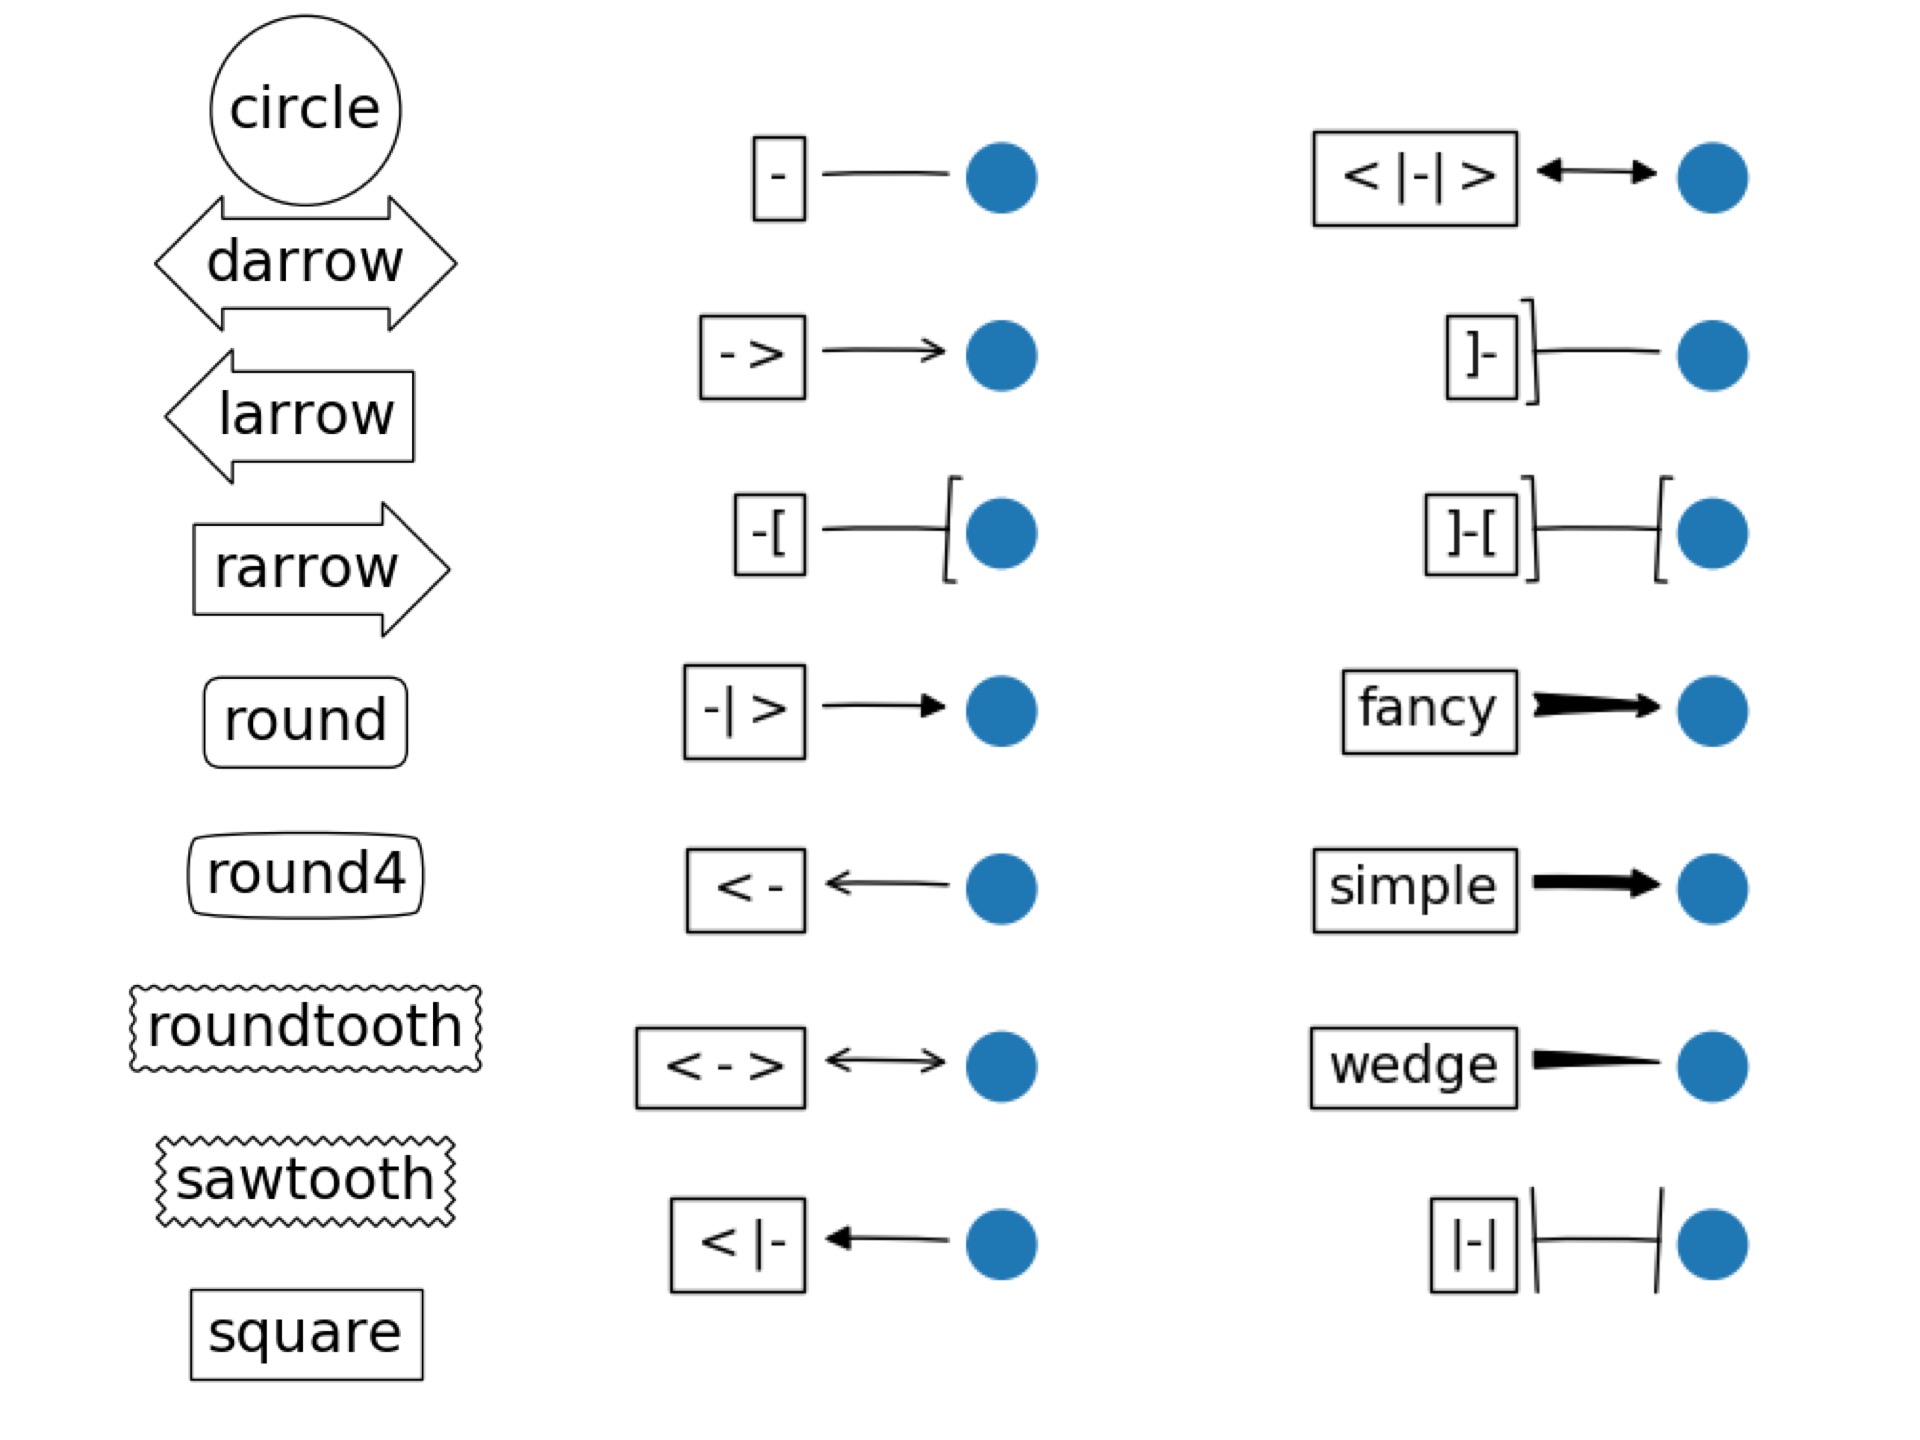
Anotate는 기본적으로 2개의 위치가 필요합니다. 하나는 Text가 위치할 장소이고, 다른 하나는 화살표가 가리킬 장소입니다. 위 예에서는 두 위치 모두 데이타 기준으로 설정되었습니다. ("xycoords='data'"; 그 외 다양한 방식이 가능합니다.) 화살표도 다양한 형식이 이미 정의되어 있습니다. 자세한 내용은
[Annotation](https://matplotlib.org/users/annotations.html)
[Axes.annotate(*args, **kwargs)](https://matplotlib.org/api/_as_gen/matplotlib.axes.Axes.annotate.html#matplotlib.axes.Axes.annotate)
[matplotlib.patches.FancyArrowPatch](https://matplotlib.org/api/_as_gen/matplotlib.patches.FancyArrowPatch.html#matplotlib.patches.FancyArrowPatch)
를 참조하시길 바랍니다.
위 Annotation 예제페이지에 있는 그림 몇 장 보시면 어떤 것들이 가능한지 감이 잡힐 것 같습니다.
| author | dj-on-steem |
|---|---|
| permlink | matplotlib-03-axes-setup-text-label-and-annotation |
| category | kr-dev |
| json_metadata | {"tags":["kr-dev","kr","kr-newbie","matplotlib","krwhale"],"image":["https://steemitimages.com/DQmYKQimfxDDWkhXYbyW5YBn3XQGHVcK7d5ESWLwnutwxxD/image.png","https://steemitimages.com/DQmR8roedp3p3LTBCghvqCA5wYwJgNAP6TXuL3WA7wTpUu7/03_axes_setup.textlabelannot1.gif","https://steemitimages.com/DQmdXSugW2atL9Ab2kzbK4sEjawWrrjTWRGpuznFnqYDpTg/03_axes_setup.textlabel2a.png","https://steemitimages.com/DQmZxFESUB9NkordhSygbL2wCWxLphfwsAftXwbX16Thpm8/03_axes_setup.textlabel3ex1.jpg","https://steemitimages.com/DQmXT5p4rpj32Ty5CUQuSodA5RSSAXTCGJLYMH7f2H6ptpk/03_axes_setup.textlabel3ex2.jpg"],"links":["https://matplotlib.org/api/_as_gen/matplotlib.axes.Axes.set_xlabel.html#matplotlib.axes.Axes.set_xlabel","https://matplotlib.org/api/_as_gen/matplotlib.axes.Axes.set_ylabel.html#matplotlib.axes.Axes.set_ylabel","https://matplotlib.org/users/annotations.html","https://matplotlib.org/api/_as_gen/matplotlib.axes.Axes.annotate.html#matplotlib.axes.Axes.annotate","https://matplotlib.org/api/_as_gen/matplotlib.patches.FancyArrowPatch.html#matplotlib.patches.FancyArrowPatch"],"app":"steemit/0.1","format":"markdown"} |
| created | 2018-02-20 22:26:42 |
| last_update | 2018-02-20 22:26:42 |
| depth | 0 |
| children | 6 |
| last_payout | 2018-02-27 22:26:42 |
| cashout_time | 1969-12-31 23:59:59 |
| total_payout_value | 1.000 HBD |
| curator_payout_value | 0.312 HBD |
| pending_payout_value | 0.000 HBD |
| promoted | 0.000 HBD |
| body_length | 5,939 |
| author_reputation | 13,250,626,745,516 |
| root_title | "[Matplotlib] 03. Axes Setup: Text, Label, and Annotation" |
| beneficiaries | [] |
| max_accepted_payout | 1,000,000.000 HBD |
| percent_hbd | 10,000 |
| post_id | 39,182,134 |
| net_rshares | 238,149,953,419 |
| author_curate_reward | "" |
| voter | weight | wgt% | rshares | pct | time |
|---|---|---|---|---|---|
| beoped | 0 | 18,108,055,877 | 14% | ||
| krwhale | 0 | 201,026,680,058 | 40% | ||
| insidebig | 0 | 10,142,976,476 | 100% | ||
| nineday85 | 0 | 591,765,016 | 100% | ||
| oprth | 0 | 4,642,554,563 | 100% | ||
| deep-root | 0 | 614,462,779 | 100% | ||
| trueonot | 0 | 3,023,458,650 | 10% |
matlab은 라이센스 문제 때문에 부분적으로 가지고있는 코드들을 python으로 옮길까 하는데 올려주신 라이브러리를 활용하면 좋을 것 같아요!
python 코드 작성하실때 주로 사용하시는 에디터가 있으신가요?? :)
| author | deep-root |
|---|---|
| permlink | re-dj-on-steem-matplotlib-03-axes-setup-text-label-and-annotation-20180224t063311416z |
| category | kr-dev |
| json_metadata | {"tags":["kr-dev"],"app":"steemit/0.1"} |
| created | 2018-02-24 06:33:12 |
| last_update | 2018-02-24 06:33:12 |
| depth | 1 |
| children | 1 |
| last_payout | 2018-03-03 06:33:12 |
| cashout_time | 1969-12-31 23:59:59 |
| total_payout_value | 0.000 HBD |
| curator_payout_value | 0.000 HBD |
| pending_payout_value | 0.000 HBD |
| promoted | 0.000 HBD |
| body_length | 121 |
| author_reputation | 40,750,743,937 |
| root_title | "[Matplotlib] 03. Axes Setup: Text, Label, and Annotation" |
| beneficiaries | [] |
| max_accepted_payout | 1,000,000.000 HBD |
| percent_hbd | 10,000 |
| post_id | 40,022,820 |
| net_rshares | 0 |
아, 막줄에 질문이 있었군요. 이제사 봤습니다.
전 그냥 emacs 쓰고 있습니다. 개인컴에서는 Atom도 가끔 쓰는데, 서버에서 직접 작업할 때에는 vi보다는 emacs가 나아서요. ㅎㅎ
| author | dj-on-steem |
|---|---|
| permlink | re-deep-root-re-dj-on-steem-matplotlib-03-axes-setup-text-label-and-annotation-20180227t205156736z |
| category | kr-dev |
| json_metadata | {"tags":["kr-dev"],"app":"steemit/0.1"} |
| created | 2018-02-27 20:51:57 |
| last_update | 2018-02-27 20:51:57 |
| depth | 2 |
| children | 0 |
| last_payout | 2018-03-06 20:51:57 |
| cashout_time | 1969-12-31 23:59:59 |
| total_payout_value | 0.000 HBD |
| curator_payout_value | 0.000 HBD |
| pending_payout_value | 0.000 HBD |
| promoted | 0.000 HBD |
| body_length | 106 |
| author_reputation | 13,250,626,745,516 |
| root_title | "[Matplotlib] 03. Axes Setup: Text, Label, and Annotation" |
| beneficiaries | [] |
| max_accepted_payout | 1,000,000.000 HBD |
| percent_hbd | 10,000 |
| post_id | 40,956,086 |
| net_rshares | 0 |
This post received a 40% upvote from @krwhale thanks to @dj-on-steem! For more information, <a href=https://steemit.com/krwhale/@krwhale/krwhale-v2018-02-22>click here</a>!<br>이 글은 @dj-on-steem님의 소중한 스팀/스팀달러를 지원 받아 40% 보팅 후 작성한 글입니다. 이 글에 대한 자세한 정보를 원하시면, <a href=https://steemit.com/krwhale/@krwhale/krwhale-v2018-02-22>click here</a>!
| author | krwhale |
|---|---|
| permlink | re-matplotlib-03-axes-setup-text-label-and-annotation-20180225t001405 |
| category | kr-dev |
| json_metadata | "" |
| created | 2018-02-25 00:14:06 |
| last_update | 2018-02-25 00:14:06 |
| depth | 1 |
| children | 0 |
| last_payout | 2018-03-04 00:14:06 |
| cashout_time | 1969-12-31 23:59:59 |
| total_payout_value | 0.000 HBD |
| curator_payout_value | 0.000 HBD |
| pending_payout_value | 0.000 HBD |
| promoted | 0.000 HBD |
| body_length | 336 |
| author_reputation | 6,819,448,047,761 |
| root_title | "[Matplotlib] 03. Axes Setup: Text, Label, and Annotation" |
| beneficiaries | [] |
| max_accepted_payout | 1,000,000.000 HBD |
| percent_hbd | 10,000 |
| post_id | 40,209,167 |
| net_rshares | 0 |
Python 보다는 Matlab 코드 같아 보여요. ^^;
그래프가 많아서 그런가요? ^^;

나중에 그래프 그릴일이 있으면 도움을 요청할지도 모르겠습니다.

요샌 수치해석쪽에는 R이 핫하던데 그건 어떠세요?
| author | trueonot |
|---|---|
| permlink | re-dj-on-steem-matplotlib-03-axes-setup-text-label-and-annotation-20180220t233940643z |
| category | kr-dev |
| json_metadata | {"tags":["kr-dev"],"app":"steemit/0.1"} |
| created | 2018-02-20 23:39:42 |
| last_update | 2018-02-20 23:39:42 |
| depth | 1 |
| children | 2 |
| last_payout | 2018-02-27 23:39:42 |
| cashout_time | 1969-12-31 23:59:59 |
| total_payout_value | 0.000 HBD |
| curator_payout_value | 0.000 HBD |
| pending_payout_value | 0.000 HBD |
| promoted | 0.000 HBD |
| body_length | 116 |
| author_reputation | 6,896,205,518,505 |
| root_title | "[Matplotlib] 03. Axes Setup: Text, Label, and Annotation" |
| beneficiaries | [] |
| max_accepted_payout | 1,000,000.000 HBD |
| percent_hbd | 10,000 |
| post_id | 39,194,441 |
| net_rshares | 0 |
Matlab을 아시는군요!
Python의 그림그리는 라이브러리 이름 부터가 "Matplotlib"에요. 즉 매트랩을 따라했다는 거죠. 당연히 비슷해보일거에요.
R은 아무래도 통계쪽에 특화되어 있는데, 저같은 경우 파이쏜으로 거의 모든 일을 할 수 있어서 굳이 R을 또 배우려는 동기가 안생기더라구요. 슬쩍 봤는데 둘 간에 좀 헷갈릴만한 문법도 좀 있구요.
| author | dj-on-steem |
|---|---|
| permlink | re-trueonot-re-dj-on-steem-matplotlib-03-axes-setup-text-label-and-annotation-20180221t045245151z |
| category | kr-dev |
| json_metadata | {"tags":["kr-dev"],"app":"steemit/0.1"} |
| created | 2018-02-21 04:52:45 |
| last_update | 2018-02-21 04:52:45 |
| depth | 2 |
| children | 1 |
| last_payout | 2018-02-28 04:52:45 |
| cashout_time | 1969-12-31 23:59:59 |
| total_payout_value | 0.000 HBD |
| curator_payout_value | 0.000 HBD |
| pending_payout_value | 0.000 HBD |
| promoted | 0.000 HBD |
| body_length | 199 |
| author_reputation | 13,250,626,745,516 |
| root_title | "[Matplotlib] 03. Axes Setup: Text, Label, and Annotation" |
| beneficiaries | [] |
| max_accepted_payout | 1,000,000.000 HBD |
| percent_hbd | 10,000 |
| post_id | 39,250,448 |
| net_rshares | 0 |
matlab이야 워낙 독보적이니깐요....

전 이것저것 잡다하게 다루다 보니. ^^;
| author | trueonot |
|---|---|
| permlink | re-dj-on-steem-re-trueonot-re-dj-on-steem-matplotlib-03-axes-setup-text-label-and-annotation-20180221t072736103z |
| category | kr-dev |
| json_metadata | {"tags":["kr-dev"],"app":"steemit/0.1"} |
| created | 2018-02-21 07:27:27 |
| last_update | 2018-02-21 07:27:27 |
| depth | 3 |
| children | 0 |
| last_payout | 2018-02-28 07:27:27 |
| cashout_time | 1969-12-31 23:59:59 |
| total_payout_value | 0.000 HBD |
| curator_payout_value | 0.000 HBD |
| pending_payout_value | 0.000 HBD |
| promoted | 0.000 HBD |
| body_length | 49 |
| author_reputation | 6,896,205,518,505 |
| root_title | "[Matplotlib] 03. Axes Setup: Text, Label, and Annotation" |
| beneficiaries | [] |
| max_accepted_payout | 1,000,000.000 HBD |
| percent_hbd | 10,000 |
| post_id | 39,278,757 |
| net_rshares | 0 |