Hi there. I have not posted an R programming post in a long while. Here it is.
This post is on boxplots in R with the `ggplot2` package.
### Sections
---
* A Quick Overview Of Boxplots
* Example One - Denim Waste Data
* Example Two - Grades In A Statistics Class
* References
### A Quick Overview Of Boxplots
---
Boxplots are one form of data visualization which features the spread of numeric values.
Consider the boxplot summary image below.
<center><img src="http://www.physics.csbsju.edu/stats/simple.box.defs.gif" /></center>
<center><a href="http://www.physics.csbsju.edu/stats/simple.box.defs.gif">Image Source</a></center>
* The largest number in a set of values is the maximum.
* In a set of values, the smallest number in a set of values is the minimum.
* The median is the "middle number" where half of the values are above it and the other half are below this median number.
* In the first quartile (Q1), 75% of values are above this and 25% of values are below this.
* In the third quartile (Q3), 75% of values are above this and 25% of values are below this.
* The interquartile range (IQR), is the difference of the third quartile and the first quartile (Q3 minus Q1).
The following two examples feature datasets from the `faraway` library in R. You can install the `faraway` library with the code:
`install.packages("faraway")`
### Example One - Denim Waste Data
---
This first example features denim waste data from the faraway library in R. Here is a screenshot of the documentation (from my R Studio).
<center>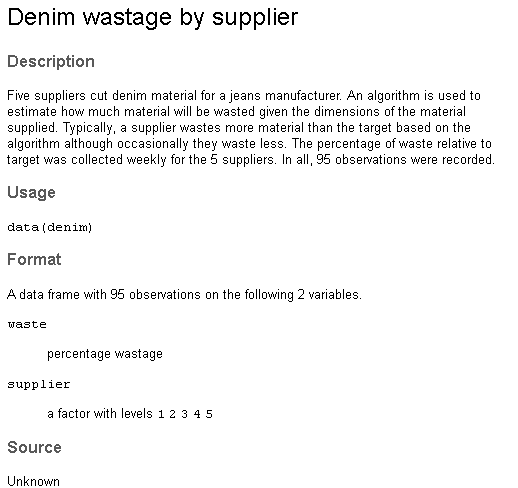</center>
The `faraway` and `ggplot2` packages are loaded into R. The `head()` and `str()` functions are used to quickly examine the dataset in R.
<center>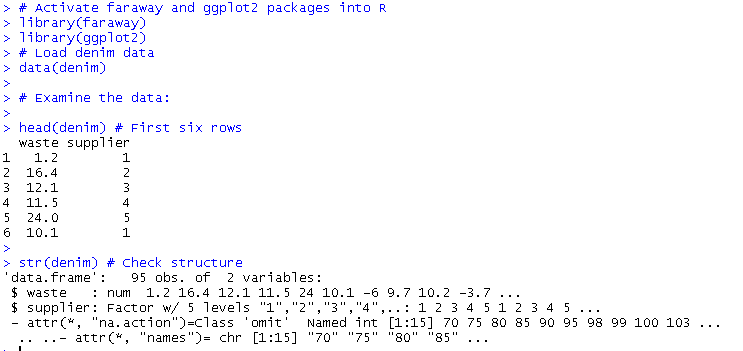</center>
The variable supplier is a factor. When the boxplot is created with the `ggplot2` package, we would have multiple boxplots with one for each supplier. Multiple boxplots are useful for visual comparisons.
<center>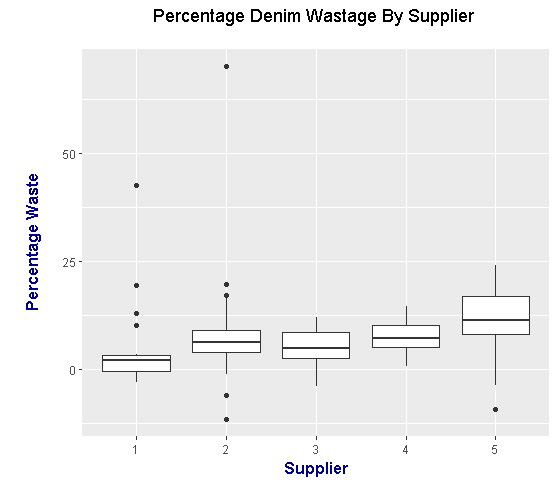</center>
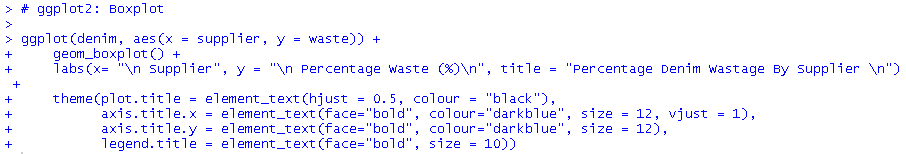
In the `ggplot()` function, the denim data is loaded in. The x-axis contains the supplier factor variable. Percentage waste in the form of the waste variable is in the y-axis. Do notice that some of the percentages are negative.
The `geom_boxplot()` add-on function is needed to produce the boxplots. Labels and the title can be produced with the `labs()` add-on function.
Label and title aesthetics such as font size, font colour and font style can be modified within the `theme()` function. Inside `theme()`, the argument `plot.title = element_text(hjust = 0.5, colour = "black")` centers the title.
### Example Two - Grades In A Statistics Class
---
This second boxplot example is on grades from a statistics class. Some data cleaning and reformatted is done in order to prepare the data for ggplot2.
<center>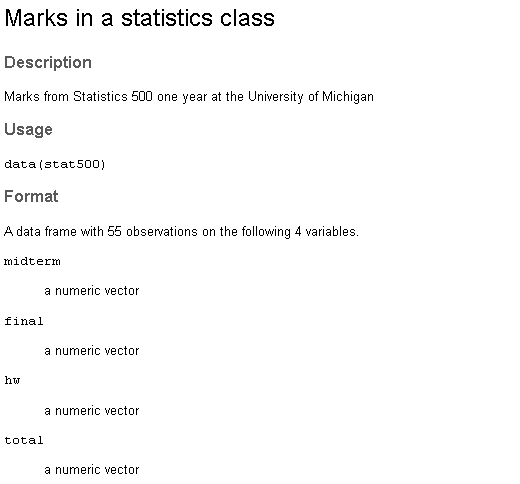</center>
I first load in the faraway, tidyr and ggplot2 packages into R.
<center>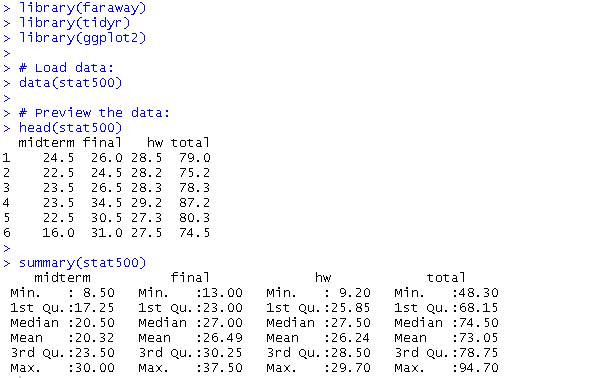</center>
From the `summary()` output, you can get an idea of the values in the dataset. The scores for midterm, final and hw are scores from the course grade of 100. These scores need to be converted to scores out of 100 percent. The same scaling is needed for boxplots.
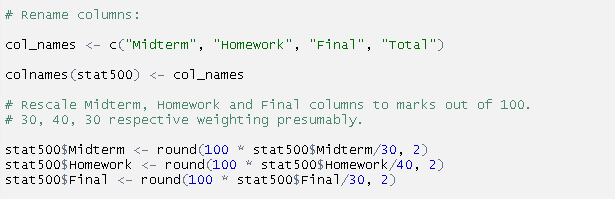
The next lines of code involve renaming column names and rescaling the grades.
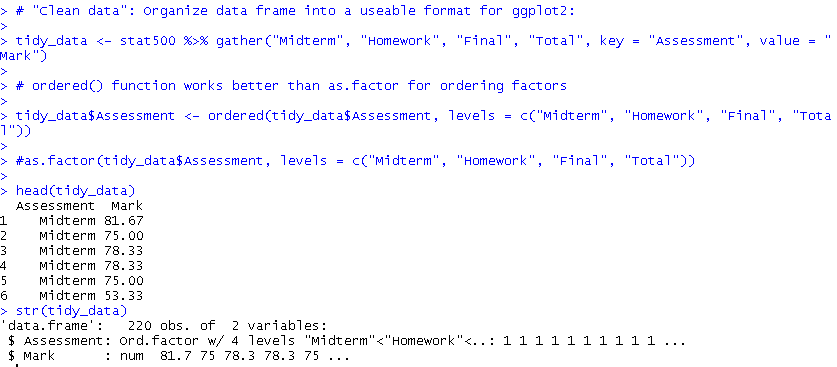
The data right now is not ready for ggplot2. The `gather()` function from the tidyr package is used to convert the data from a wide format to a long format. I then convert the Assessment column as ordered factors. Ordered factors help preserve order in the boxplots.
Now that the data is ready, producing the boxplot with R's ggplot2 should not be too difficult. This code is very similar to Example One's code.
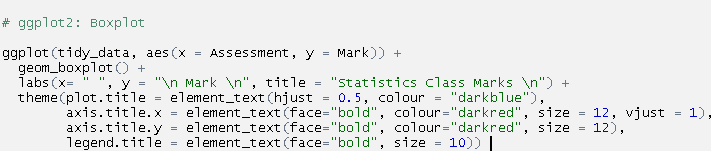
<center>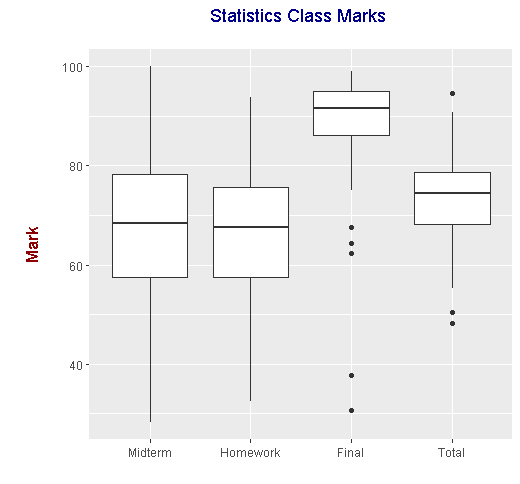</center>
In the `Final` boxplot, those bottom five data points outside of the box are outliers. Those data points represent really below average scores on the final exam (or assignment).
The median final grade as indicated by the thick black line appears to be around 75 percent. Do not confuse this with the mean (average).
### References
---
* http://www.cookbook-r.com/Manipulating_data/Changing_the_order_of_levels_of_a_factor/
* http://www.physics.csbsju.edu/stats/box2.html
* https://www.mathsisfun.com/data/quartiles.html
* R Graphics Cookbook By Winston Chang is a good book for ggplot2 reference code.| author | dkmathstats |
|---|---|
| permlink | boxplots-in-r-with-ggplot2 |
| category | programming |
| json_metadata | {"tags":["programming","steemstem","statistics","r","mathematics"],"image":["http://www.physics.csbsju.edu/stats/simple.box.defs.gif","https://steemitimages.com/DQmV88eRW5V688V3wGXW8Nn9duizv14V1FLVDAbMKyZRwV7/denim_doc.PNG","https://steemitimages.com/DQmPKyP5ZVXHSnfTwTpdDo5a7RGn4N8DuoYRuaQWbCH11Jb/denim01.PNG","https://steemitimages.com/DQmbWt9h51rppnjPuBXYxjeJTSdjx7WBFJ8S9tMLzaCfDTg/denim02.PNG","https://steemitimages.com/DQmf19x2fN3V5G3M4p9YwwtwygBLXdpzhVKEN6JhgW5wp1t/denim_boxplot.png","https://steemitimages.com/DQmYhB1z9Ce2NqnqeCuC5spQRSogbYEsg57Zh9PHRqJvAFa/statsClass_doc.PNG","https://steemitimages.com/DQmZBP4iFt7onHQNQfoAX3eu67sgKoXtPyVdEkSRPxqaURU/statsClass_01.PNG","https://steemitimages.com/DQmR2ZhwX5B2YqHRY6EmthDUhqvAwqEuUVAxqb44pu2y2Bj/statsClass_02.PNG","https://steemitimages.com/DQmQ4Dr8kHve51VQWn4Wt6Xz9ZsfLeKzH4nHsqSwurJAUuU/statsClass_03.PNG","https://steemitimages.com/DQmXFECASQ7MU1EA6xGUi8HHu61inEB5XZZe5aMHuyK6xiJ/statsClass_04.PNG","https://steemitimages.com/DQmcF9ZeozAxEbfXhvujMbDWDYLEsT9AU5w8sAGyBnbBu2M/stats500_plot.png"],"links":["http://www.physics.csbsju.edu/stats/simple.box.defs.gif","http://www.cookbook-r.com/Manipulating_data/Changing_the_order_of_levels_of_a_factor/","http://www.physics.csbsju.edu/stats/box2.html","https://www.mathsisfun.com/data/quartiles.html"],"app":"steemit/0.1","format":"markdown"} |
| created | 2017-12-21 04:26:18 |
| last_update | 2017-12-21 04:26:18 |
| depth | 0 |
| children | 1 |
| last_payout | 2017-12-28 04:26:18 |
| cashout_time | 1969-12-31 23:59:59 |
| total_payout_value | 13.072 HBD |
| curator_payout_value | 4.080 HBD |
| pending_payout_value | 0.000 HBD |
| promoted | 0.000 HBD |
| body_length | 5,348 |
| author_reputation | 150,253,198,901,782 |
| root_title | "Boxplots In R With ggplot2" |
| beneficiaries | [] |
| max_accepted_payout | 1,000,000.000 HBD |
| percent_hbd | 10,000 |
| post_id | 24,461,905 |
| net_rshares | 2,756,198,490,080 |
| author_curate_reward | "" |
| voter | weight | wgt% | rshares | pct | time |
|---|---|---|---|---|---|
| fminerten | 0 | 173,665,631,288 | 5% | ||
| steempty | 0 | 135,875,382,591 | 5% | ||
| pharesim | 0 | 106,465,793,813 | 0.03% | ||
| lafona-miner | 0 | 161,664,503,938 | 5% | ||
| kushed | 0 | 4,777,327,981 | 2% | ||
| xeroc | 0 | 883,232,062 | 0.6% | ||
| steem-id | 0 | 6,454,677,699 | 0.6% | ||
| bue | 0 | 13,772,710,082 | 100% | ||
| blakemiles84 | 0 | 1,481,935,512 | 0.6% | ||
| justtryme90 | 0 | 232,270,766,924 | 8.5% | ||
| anwenbaumeister | 0 | 51,046,398,966 | 2% | ||
| phenom | 0 | 534,281,022 | 0.6% | ||
| bitcoiner | 0 | 3,316,030,898 | 0.6% | ||
| liberosist | 0 | 128,677,870,738 | 2% | ||
| cryptoninja | 0 | 85,021,021 | 1% | ||
| toxichan | 0 | 451,677,833 | 2% | ||
| timsaid | 0 | 7,195,345,668 | 2% | ||
| cristi | 0 | 70,829,451,546 | 20% | ||
| kyriacos | 0 | 20,133,009,807 | 5% | ||
| lemouth | 0 | 24,992,048,139 | 10% | ||
| rjbauer85 | 0 | 315,735,293 | 10% | ||
| anarchyhasnogods | 0 | 23,300,971,813 | 10% | ||
| lamouthe | 0 | 1,236,473,615 | 10% | ||
| dan-bn | 0 | 4,528,007,030 | 0.6% | ||
| anomaly | 0 | 371,969,796 | 1% | ||
| steemedia | 0 | 213,319,003 | 2% | ||
| meerkat | 0 | 23,153,244,338 | 2% | ||
| donchate | 0 | 125,287,630 | 2% | ||
| saiku | 0 | 287,188,377 | 2% | ||
| curie | 0 | 100,272,720,029 | 2% | ||
| cebymaster | 0 | 264,763,389 | 2% | ||
| trueart | 0 | 301,602,412 | 2% | ||
| techslut | 0 | 26,207,372,497 | 2% | ||
| hendrikdegrote | 0 | 1,080,678,433,384 | 2% | ||
| steemstem | 0 | 102,532,230,143 | 10% | ||
| cotidiana | 0 | 237,487,749 | 2% | ||
| foundation | 0 | 869,401,946 | 10% | ||
| the-devil | 0 | 2,128,878,050 | 10% | ||
| dna-replication | 0 | 2,768,099,139 | 10% | ||
| pacokam8 | 0 | 70,921,740 | 0.4% | ||
| awesomianist | 0 | 788,177,528 | 2% | ||
| jamhuery | 0 | 2,755,567,532 | 10% | ||
| jhagi.bhai | 0 | 91,710,411 | 0.2% | ||
| manuel78 | 0 | 179,597,000 | 2% | ||
| hansenator | 0 | 58,126,166,154 | 100% | ||
| kingyus | 0 | 57,661,286 | 2.5% | ||
| papadimos | 0 | 2,497,335,057 | 10% | ||
| mobbs | 0 | 6,991,434,268 | 5% | ||
| shahzadnisar | 0 | 274,384,571 | 2% | ||
| bp423 | 0 | 596,677,099 | 2% | ||
| oscarcc89 | 0 | 101,698,659 | 0.2% | ||
| kenchung | 0 | 775,582,524 | 2% | ||
| trumpman | 0 | 5,545,658,067 | 10% | ||
| robertvogt | 0 | 406,245,724 | 2% | ||
| diggerdugg | 0 | 187,198,404 | 2% | ||
| dber | 0 | 8,203,935,315 | 10% | ||
| derosnec | 0 | 72,719,853 | 0.4% | ||
| kerriknox | 0 | 31,208,994,099 | 10% | ||
| alexander.alexis | 0 | 447,782,460 | 2% | ||
| sieses | 0 | 216,674,942 | 2% | ||
| suesa | 0 | 87,194,124,217 | 25% | ||
| erangvee | 0 | 1,616,796,851 | 2% | ||
| rockeynayak | 0 | 61,640,015 | 10% | ||
| nitesh9 | 0 | 2,042,112,157 | 10% | ||
| himal | 0 | 436,205,627 | 10% | ||
| ewuoso | 0 | 612,187,756 | 3% | ||
| ovij | 0 | 1,353,570,749 | 10% | ||
| gamesjoyce | 0 | 347,209,476 | 2% | ||
| olanrewaju | 0 | 101,618,530 | 3% | ||
| somethingburger | 0 | 4,276,842,010 | 100% | ||
| pearlumie | 0 | 2,392,831,370 | 10% | ||
| webresultat | 0 | 197,645,183 | 2% | ||
| cryptogrind | 0 | 1,954,043,118 | 100% | ||
| rayken04 | 0 | 60,142,208 | 10% | ||
| playitforward | 0 | 134,754,920 | 0.4% | ||
| mrblinddraw | 0 | 244,079,230 | 0.6% | ||
| imamalkimas | 0 | 123,833,892 | 10% | ||
| rachelsmantra | 0 | 488,806,348 | 10% | ||
| gra | 0 | 3,382,417,161 | 10% | ||
| socialspace | 0 | 955,501,147 | 2% | ||
| kedi | 0 | 2,449,690,891 | 10% | ||
| jasimg | 0 | 3,352,687,367 | 2% | ||
| mindhacks | 0 | 347,436,005 | 10% | ||
| raci | 0 | 108,737,849 | 2% | ||
| ongoingwow | 0 | 396,410,542 | 8% | ||
| xanderslee | 0 | 140,943,663 | 2% | ||
| amavi | 0 | 1,316,062,367 | 2% | ||
| geekpowered | 0 | 3,179,945,282 | 2% | ||
| melanie00 | 0 | 360,639,223 | 2% | ||
| gentleshaid | 0 | 2,146,562,409 | 10% | ||
| karinaisunts | 0 | 89,221,400 | 100% | ||
| shawnvanderveer | 0 | 371,385,263 | 2% |
this might as well have been written in german for all the sense that i could make of it, keep it up though, we need the front end guys like you to keep pushing the tech forward ... an upvote from me! :)
| author | cryptogrind |
|---|---|
| permlink | re-dkmathstats-boxplots-in-r-with-ggplot2-20171221t042811030z |
| category | programming |
| json_metadata | {"tags":["programming"],"app":"steemit/0.1"} |
| created | 2017-12-21 04:28:12 |
| last_update | 2017-12-21 04:28:12 |
| depth | 1 |
| children | 0 |
| last_payout | 2017-12-28 04:28:12 |
| cashout_time | 1969-12-31 23:59:59 |
| total_payout_value | 0.000 HBD |
| curator_payout_value | 0.000 HBD |
| pending_payout_value | 0.000 HBD |
| promoted | 0.000 HBD |
| body_length | 203 |
| author_reputation | 5,515,908,549,737 |
| root_title | "Boxplots In R With ggplot2" |
| beneficiaries | [] |
| max_accepted_payout | 1,000,000.000 HBD |
| percent_hbd | 10,000 |
| post_id | 24,462,132 |
| net_rshares | 0 |