Hi there. This post features experimental R programming work for text analysis and text mining on a few song lyrics. The full complete version of this post can be found on my website [here](http://dkmathstats.com/using-r-for-text-analysis-on-a-few-song-lyrics/).
<center><img src="http://freedesignfile.com/upload/2014/10/Hand-drawn-colored-musical-instruments-vector-01.jpg" /></center>
<center><a href="http://freedesignfile.com/upload/2014/10/Hand-drawn-colored-musical-instruments-vector-01.jpg">Featured Image: Source</a></center>
### Sections
---
* Text Mining And Text Analysis With R
* Example One: Armin Van Buuren Feat. Fiora - Waiting For The Night
* Example Two: Linkin Park - New Divide (No Code, Output Only)
* Notes
### Text Mining And Text Analysis With R
---
The R programming language is capable of all kinds of statistical work and data analysis. One of those tasks includes text mining and text analysis. Text analysis can be done on reviews, Youtube comments, text from articles and song lyrics.
For this project, the R packages that are needed are `dplyr` for data wrangling, `ggplot2` for plotting and `tidytext` for data cleaning. Text analysis will be done on three songs. The lyrics from these songs were copied and pasted from lyrics websites into separate .txt files.
To load a package into R, use the `library()` or `require()` command. To install a package into R, use the command `install.packages("pkg_name")`.
```{r}
library(dplyr)
library(ggplot2)
library(tidytext)
```
### Example One: Armin Van Buuren Feat. Fiora - Waiting For The Night
---
For this first example, I have chosen the track Waiting For The Night from DJ/Producer Armin Van Buuren featuring the vocals of Fiora. (This song falls under the Dance category.)
<center><img src="https://i.ytimg.com/vi/7YpaAR077xA/hqdefault.jpg" /></center>
<center><a href="https://i.ytimg.com/vi/7YpaAR077xA/hqdefault.jpg">Armin Van Buuren - Waiting For The Night Album Image Cover: Source</a></center>
I have named the lyrics text file as `armin_waitingForTheNight.txt`. When you are reading text files offline, you need to set a working directory. In my case, this file is placed inside a folder called `songLyrics_project` on my PC. The working directory would be set to this folder (with RStudio).
```{r}
armin_waiting_lyrics <- readLines("armin_waitingForTheNight.txt")
head(armin_waiting_lyrics) #Preview lyrics.
[1] "Shoot me down and I'll get up again"
[2] "Emotions running high with double meaning"
[3] "Just another day to keep it calm within"
[4] "But I can't find a way to fight this shadow dreaming"
[5] ""
[6] "We're always waiting for the night"
The lyrics are then put into a data frame in R.
> armin_waiting_lyrics_df <- data_frame(Text = armin_waiting_lyrics) # tibble aka neater data frame
>
> head(armin_waiting_lyrics_df, n = 20)
# A tibble: 20 x 1
Text
<chr>
1 Shoot me down and I'll get up again
2 Emotions running high with double meaning
3 Just another day to keep it calm within
4 But I can't find a way to fight this shadow dreaming
5
6 We're always waiting for the night
7 Never lost cause we can go where the light shines brightest
8 We're always waiting for the night
9 So come with me and we can go where the light shines brightest
10
11 Stay all night, runaway all night
12 We'll stay all night, run away all night
13 Stay all night, runaway all night
14 We'll stay all night, run away all night...
15
16 Push and shove against the thoughts you left me with
17 Of, every picture of regret my expectation
18 Your emotions can't hide behind those eyes
19 Conversations comes quick to steal me back again
armin_words <- armin_waiting_lyrics_df %>%
unnest_tokens(output = word, input = Text)
```
There are words in the English language that do not carry much meaning on their own but they are used to make sentences flow and make grammar proper. Words such as `the`, `and`, `of`, `me`, `that`, `this`, etc. are referred to as stop words.
From R's `dplyr` package, the `anti_join()` function is used to remove stop words from stop_words which are in the lyrics. (The object stop_words is a dataset.)
```{r}
# data(stop_words) # Stop words.
# Remove stop words:
armin_words <- armin_words %>%
anti_join(stop_words)
```
To achieve the word counts, the count function from R's `dplyr` package is used to obtain counts. Adding the `sort = TRUE` argument will sort the counts.
```{r}
> # Word Counts:
>
> armin_wordcounts <- armin_words %>% count(word, sort = TRUE)
>
> head(armin_wordcounts)
# A tibble: 6 x 2
word n
<chr> <int>
1 night 12
2 brightest 4
3 light 4
4 shines 4
5 stay 4
6 waiting 4
```
We can now make a plot of the word counts with R's `ggplot2` data visualization package.
```{r}
# ggplot2 Plot (Counts greater than 8)
# Bottom axis removed with element_blank()
# Counts in the bar with geom_text.
armin_wordcounts %>%
mutate(word = reorder(word, n)) %>%
ggplot(aes(word, n)) +
geom_col(fill = "blue") +
coord_flip() +
labs(x = "Word \n", y = "\n Count ", title = "Word Counts In \n Armin Van Buuren - Waiting For The Night \n") +
geom_text(aes(label = n), hjust = 1.2, colour = "white", fontface = "bold") +
theme(plot.title = element_text(hjust = 0.5),
axis.title.x = element_blank(),
axis.ticks.x = element_blank(),
axis.text.x = element_blank(),
axis.title.y = element_text(face="bold", colour="darkblue", size = 12))
```
<center>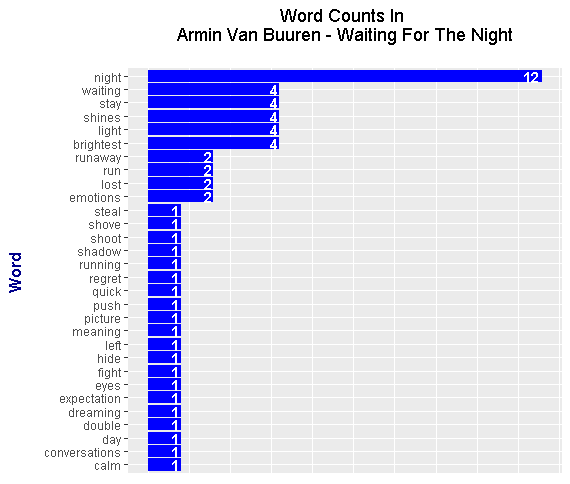</center>
It appears that the word night is the most frequent word with a count of 12.
**Sentiment Analysis Of Armin Van Buuren - Waiting For The Night**
For song lyrics, sentiment analysis analyzes words and text and determines whether a song is positive or negative. (Note that this sort of analysis does not factor in sound, melodies and such. The listeners determine this in a subjective manner.)
There are three main lexicons which determine whether a song is positive or negative. These three are `AFINN`, `bing `and `nrc`.
The `AFINN` lexicon is used here.
```{r}
get_sentiments("afinn") #AFINN sentiments
```
```{r}
armin_words_AFINN <- armin_wordcounts %>%
inner_join(get_sentiments("afinn"), by = "word") %>%
mutate(is_positive = score > 0)
armin_words_AFINN %>%
ggplot(aes(x = word, y = n, fill = is_positive)) +
geom_bar(stat = "identity", position = "identity") +
labs(x = "\n Word \n", y = "Word Count \n", title = "Sentiment Scores Of Words \n") +
theme(plot.title = element_text(hjust = 0.5),
axis.title.x = element_text(face="bold", colour="darkblue", size = 12),
axis.title.y = element_text(face="bold", colour="darkblue", size = 12)) +
scale_fill_manual(values=c("#FF0000", "#01DF3A"), guide=FALSE)
```
<center>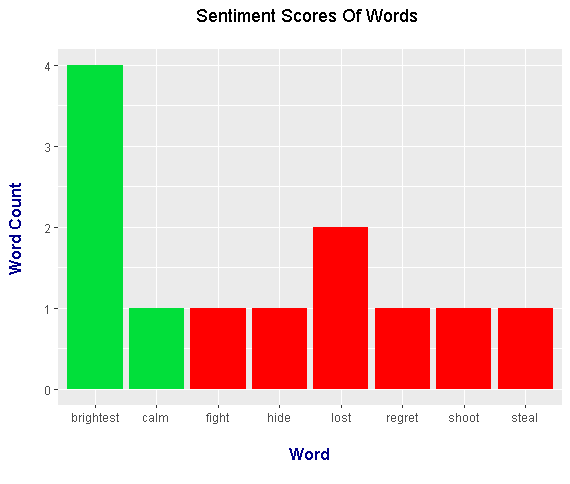
</center>
The next lines of code features a plot with words and their sentiment scores. As in the first example, sentiment scores takes the word counts multiplied by the `AFINN` lexicon score. (If the word wonderful had a word count of 3 and a score of +3, the score would be 3 x 3 = +9).
```{r}
# Assign AFINN lexicon scores to words in the book:
armin_words_AFINN_scores <- armin_wordcounts %>%
inner_join(get_sentiments("afinn"), by = "word") %>%
mutate(sentiment_score = n * score, is_positive = sentiment_score > 0)
```
We can plot the results with a plot from the `ggplot2` package.
```{r}
# Plot - Sentiment Scores Of All Words
armin_words_AFINN_scores %>%
ggplot(aes(x = word, y = sentiment_score, fill = is_positive)) +
geom_bar(stat = "identity", position = "identity") +
labs(x = "\n Word \n", y = "Sentiment Score \n", title = "Sentiment Scores Of Words \n") +
theme(plot.title = element_text(hjust = 0.5),
axis.title.x = element_text(face="bold", colour="darkblue", size = 12),
axis.title.y = element_text(face="bold", colour="darkblue", size = 12)) +
scale_fill_manual(values=c("#FF0000", "#01DF3A"), guide=FALSE)
```
<center>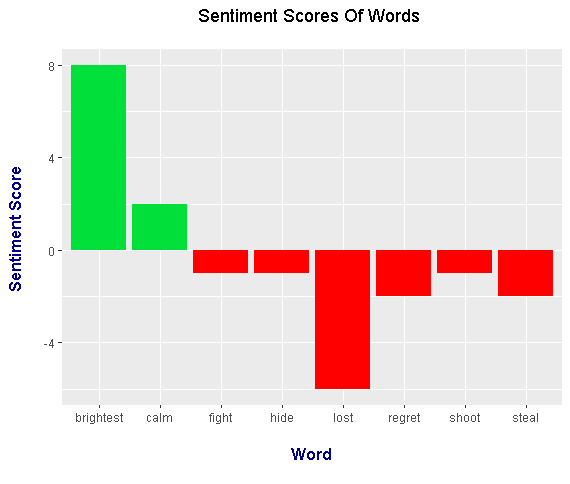
</center>
The most positive word is `brightest` while the most negative word is `lost`. This sentiment score plot is different than the word counts plot earlier in the sense there were more negative words than positive words.
### Example Two: Linkin Park - New Divide
---
<center><img src="http://farm4.staticflickr.com/3620/3545284779_926eda3146.jpg" /></center>
<center><a href="http://farm4.staticflickr.com/3620/3545284779_926eda3146.jpg">Image Source</a></center>
In the second example, I have chosen to look at the song New Divide by Linkin Park as featured in the Transformers 2 movie. The code here is very similar to the code from the first example.
To make this post a bit shorter, I will only place the output plots for this example. (No code is shown for this example.)
<center>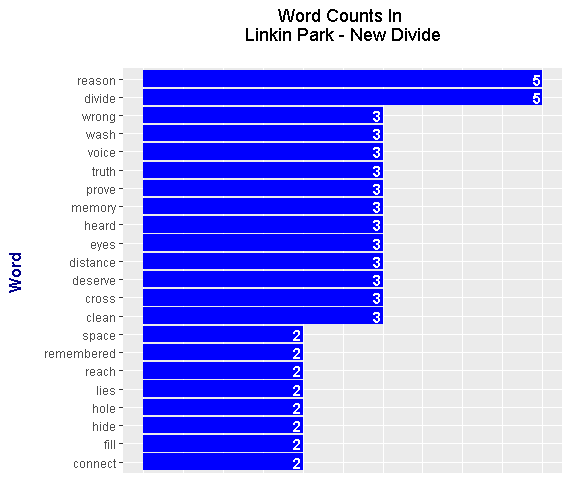</center>
<center>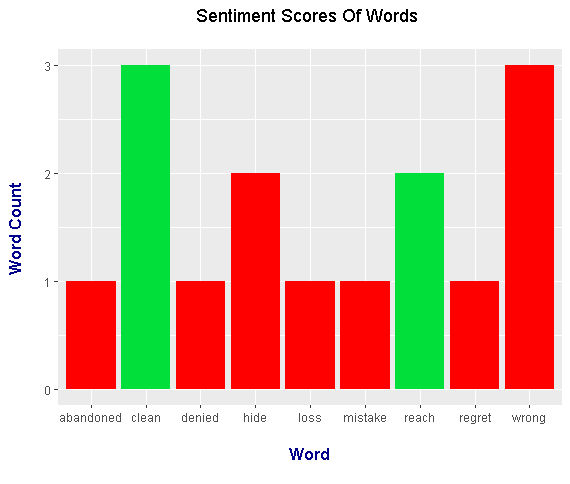</center>
<center>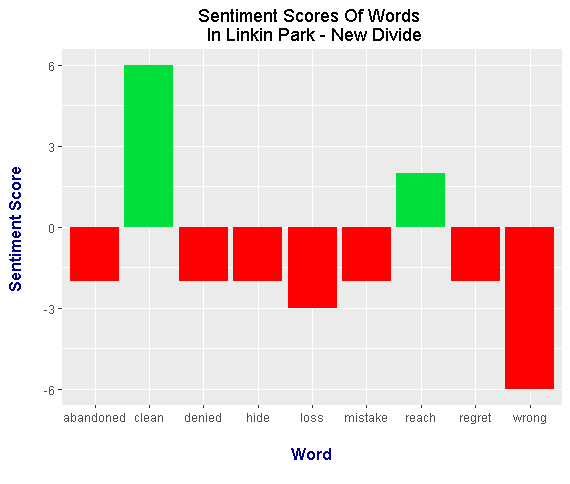
</center>
It appears that from the plots, Linkin Park - New Divide is a track with negative sentiment. This needs to further examined by looking at the full lyrics and listening to the songs.
### Notes
---
* Song lyrics do not have a lot of words in general relative to articles and books.
* Many song lyrics repeat certain phrases or words for emphasis.
* Not all songs have vocals or lyrics as some of them are instrumentals. You would have to hear those instrumentals and judge whether a song is positive or not with your own ears.
* I do plan on analyzing a music album with text mining and analysis.
References include Datacamp courses, R Graphics Cookbook by Winston Chang, Text Mining With R: A Tidy Approach By Julia Silge and David Robinson (Website version: https://www.tidytextmining.com/).