<div class= "text-justify">
- - -
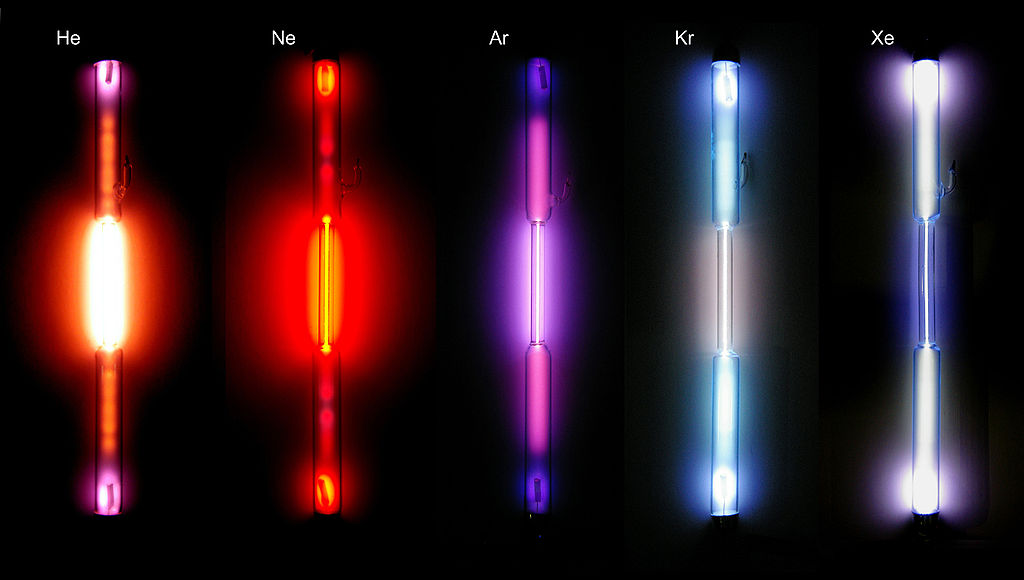
<center>_**[Spectral tubes of noble gases](https://es.wikipedia.org/wiki/Gases_nobles#/media/File:Edelgase_in_Entladungsroehren.jpg)**_</center>
- - -
Greetings to the whole community of steemit, this time I want to share with you one of the most interesting topics I saw in my course in modern physics, which deals with the spectra recorded in a spectroscope and originated by the light of different elements exposed at high temperature.
Before I start I want to define certain concepts that are basic and important for the information of this post. Light is an electromagnetic wave, capable of traveling in the void, but that when passing from one medium to another with a certain inclination it changes direction to this is known as refraction. On the other hand, visible light for us only represents a small part of the electromagnetic spectrum, located between 400nm (ultraviolet) and 750nm (infrared), above and below that value we can not see the radiation that hits us, such as radio waves and X-rays. Now given that waves are considered in these certain magnitudes, such as wavelength and frequency, in this case both elements are inversely proportional, this means that the more frequently a electromagnetic radiation is smaller, the shorter the wavelength of the electromagnetic radiation and vice versa,It is also clear that the smaller the wavelength of a signal, the more energy it has[[1](https://en.wikipedia.org/wiki/Light)]. Finally, electromagnetic radiation such as light is called wave, given the behavior that has been observed of them to behave as a said effect.
- - -
<center>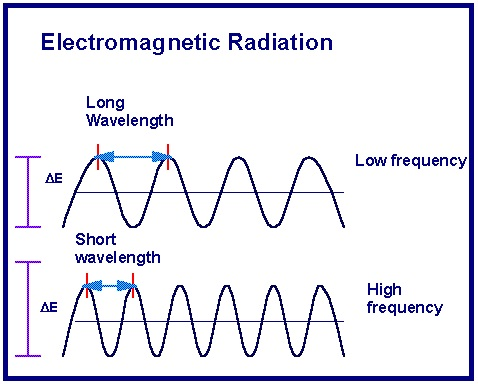<center>
[_**Details of a wave**_](https://s3-ap-southeast-1.amazonaws.com/subscriber.images/physics/2016/10/26061252/waves.jpg)</center>
- - -
<div class= "text-justify">
When you observe an object illuminated by a source of natural or artificial light, you are perfectly capable of describing how that object is, what properties it has and what color it presents, that is, its external appearance is known. But how to know its internal aspect? Well, Physics provides a technique for it: spectroscopy, which in synthesis acts in a similar way to what the view does when looking at an object. In effect, the atoms and molecules that form matter are not at rest, but are in constant motion and are capable of absorbing and emitting certain forms of electromagnetic radiation, which are characteristics of the atoms and molecules of each substance, so that a study of the frequencies and wavelengths of these radiations, provide information on the nature of the elements that emit or absorb it. Such information forms what is called the _**characteristic spectrum**_ of a substance.
- - -
<center>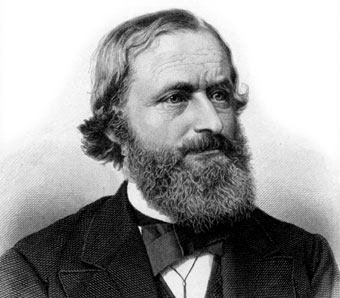</center>
<center>[_**Gustav Robert Kirchhoff**_](https://www.biografiasyvidas.com/biografia/k/fotos/kirchhoff.jpg)</center>
<center>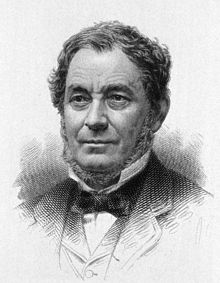</center>
<center>[_**Robert Busen**_](https://commons.wikimedia.org/wiki/File:Robert_Bunsen_02.jpg)</center>
In 1859, the German physicist [Gustav Robert Kirchhoff](https://www.britannica.com/biography/Gustav-Robert-Kirchhoff) (1824-1887) and the German chemist [Robert Wilhelm Bunsen](https://simple.wikipedia.org/wiki/Robert_Bunsen) (1811-1899) were the first to realize that each element emits and absorbs light of certain colors, which make up its characteristic spectrum. They developed the first modern instrument to study the spectra, the prism spectroscope and, they applied it to the chemical analysis. This instrument, which is one of the two main types of spectroscope, is formed by a slit, a set of lenses, a prism and an eyepiece. The light that is going to be analyzed goes through a collimating lens, which produces a narrow and parallel beam of light, and then through the prism. The image of the slit is focused with the eyepiece. In fact, what you see are a series of images of the slit, known as spectral lines, each with a different color, because the prism separates the light into the colors that compose it.
<center></center>
<center>[Representation of a prism spectroscope](http://astronomy.nju.edu.cn/~lixd/GA/AT4/AT404/IMAGES/AACHCLM0.JPG)</center>
A second type of spectroscope commonly used is the grid or grid spectroscope, first used at the beginning of the 19th century by the German physicist [Joseph von Fraunhofer](https://en.wikipedia.org/wiki/Joseph_von_Fraunhofer) (1.787-1.826).
In these instruments, the light is scattered by a diffraction network instead of a prism. A diffraction grating is a specular surface of metal or glass on which a large number of parallel lines have been drawn. A good network has a great dispersive power, so it allows to show much finer details in the spectra. The lines of the diffraction network can also be traced on a concave mirror, so that the network serves at the same time to focus the light and the use of lenses is unnecessary. In a spectroscope of this type, light does not need to go through any transparent substance, so these instruments are used throughout the ultraviolet region and in the X-ray region.
- - -
<center>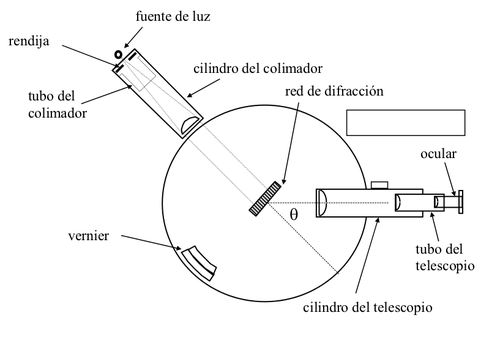</center>
<center>[Representation of a network spectroscope](http://srv2.fis.puc.cl/mediawiki/images/thumb/0/03/Esp2.png/500px-Esp2.png)</center>
I have spoken so far about the spectroscope and its usefulness for analyzing spectra, but I have not defined such concepts, so I will proceed with an explanation of this. A _**spectrum**_ is a series of rainbow-like colors-in this order: violet, blue, green, yellow, orange, and red-that is produced by dividing a composite light like white light into its constituent colors. The rainbow is a natural spectrum produced by meteorological phenomena.
- - -

<center> [Rainbow natural spectrum](http://www.todopaisajes.com/Minis/arco-iris-colorido.jpg)</center>
A similar effect can be achieved by passing sunlight through a glass prism, or by making composite, natural or artificial light in a diffraction grating (as mentioned above), if the light source is a specific substance, there is talk of characteristic spectrum. Each chemical element has a characteristic spectrum, that is, a determined distribution of electromagnetic radiation. In general, a spectrum is the band of electromagnetic radiation emitted or absorbed by a substance in given circumstances. The spectra can be classified according to several criteria, in the following way:
<center>_**Emission Spectra**_</center>
In these spectra the radiation is emitted by a substance, which is analyzed to determine the particular wavelengths produced. The emission of radiation can be induced by several methods, such as: elevation of temperature, bombardment with electrons, electric discharges, absorption of higher frequency radiation, etc.
<center>_**Absorption Spectra**_</center>
These spectra are obtained by passing through a substance a continuous flow of electromagnetic radiation, part of which is absorbed by the sample, and then the remaining radiation is analyzed to determine the absorbed wavelengths.
<center>_**Striped or Atomic Spectra**_</center>
Spectra composed of a number of discrete stripes corresponding to wavelengths other than the radiation emitted or absorbed. Stripe spectra are produced by atoms or simple ions in gases. Each ray corresponds to a change in the orbit of an electron, with emission or absorption of radiation.
<center>_**Balanced or Molecular Spectra**_</center>
These spectra are formed by a series of bright bands each of which is similar to a fragment of the continuous spectrum, separated by dark areas. These bands are not really continuous, but are formed by many closely spaced lines that can be resolved by high-resolution spectroscopy. The spacing of the lines in any series of molecular bands depends on whether the spectrum is rotational or vibrational.
As you will see there are several ways to have spectra, but the explanation of this phenomenon is in the mysterious and magical world of quantum physics, because the reason why these lines of colors are formed is because when a high amount of energy is supplied as an electric discharge to a gas of a certain element at low pressure, the atoms that make up this gas begin to collide with each other, leaving some of them in a state with more energy than an atom in a normal state, this extra energy is carried by electrons that are located in unstable orbits, so that when they are released from it to move to a stable or lower energy orbit, they release a radiation in the form of light (photons), which are the spectral lines, but why are several lines of colors displayed?,is because there are several orbits in atoms, and when an electron goes from a higher energy orbit to a lower energy orbit it does not necessarily make it to the nearest, but it can do it from the last orbit to the first instantaneously (which corresponds to a color of the spectrum), or it does it from the penultimate orbit to the first (corresponds to another color), or from the second to last one (it is another color), that is, the electron passing through different orbits releases some radiation corresponding to the change it makes in the orbits, This behavior was well described by [Niels Bohr](https://www.nobelprize.org/nobel_prizes/physics/laureates/1922/bohr-bio.html) in 1913 when he was a pubic, his atomic model.
- - -
<center>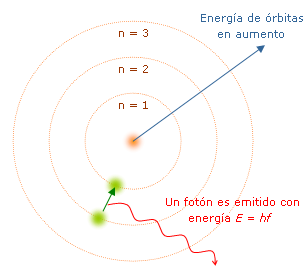</center>
<center>[Bohr's atomic model](https://upload.wikimedia.org/wikipedia/commons/d/d1/Modelo_de_Bohr.png)</center>
- - -
Such a model states that the orbits of atoms were quantified, so that each orbit corresponds to certain energy, this theory successfully explained the atomic spectrum of hydrogen, the most abundant and simple element of nature because it only has an electro that orbits it, but for atoms like a greater number of electrons, this model can not be used, since for these elements it is complex to estimate how are their "orbits", in addition the interactions between them is very complex to determine, nevertheless the elaboration advanced high resolution spectroscope it has been possible to have the spectra of most of the elements, as well as of numerical methods used in high capacity computers to create more accurate models in order to have theoretical data about these spectra.
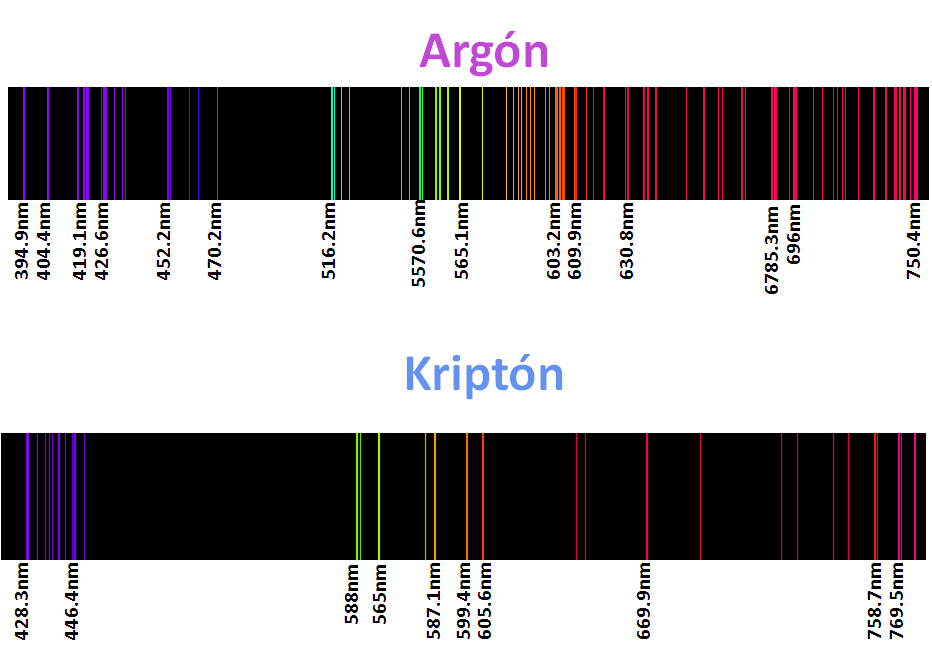
For sure they have seen warnings with neon lights, argon, kryton, helium and xenon called noble gases, but as their lights are characteristic of these elements their spectra are even more, as we mentioned each element has a characteristic spectrum, or better said his fingerprint is printed in these spectra, so that each element is identifiable according to its spectrum, that is why some of them are here.
- - -
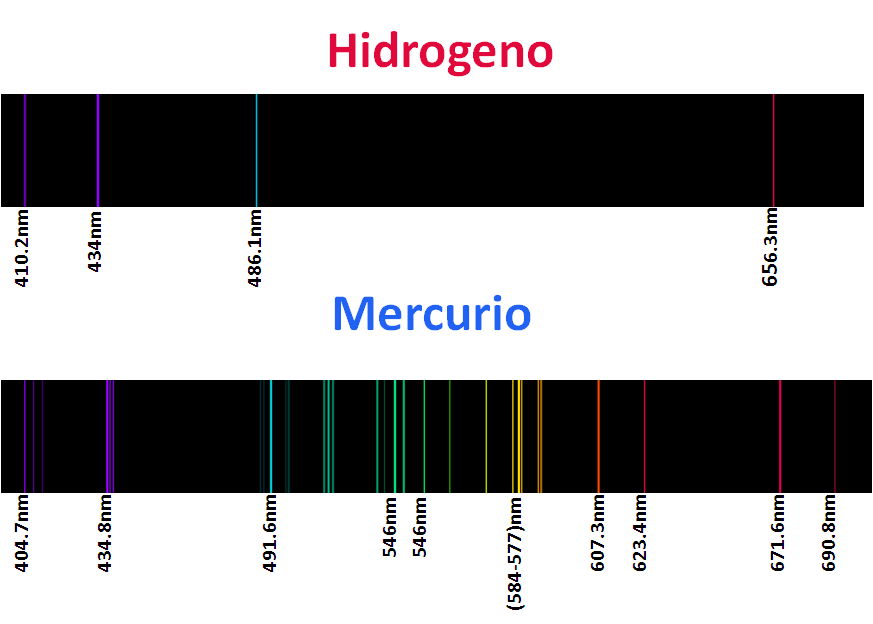
- - -
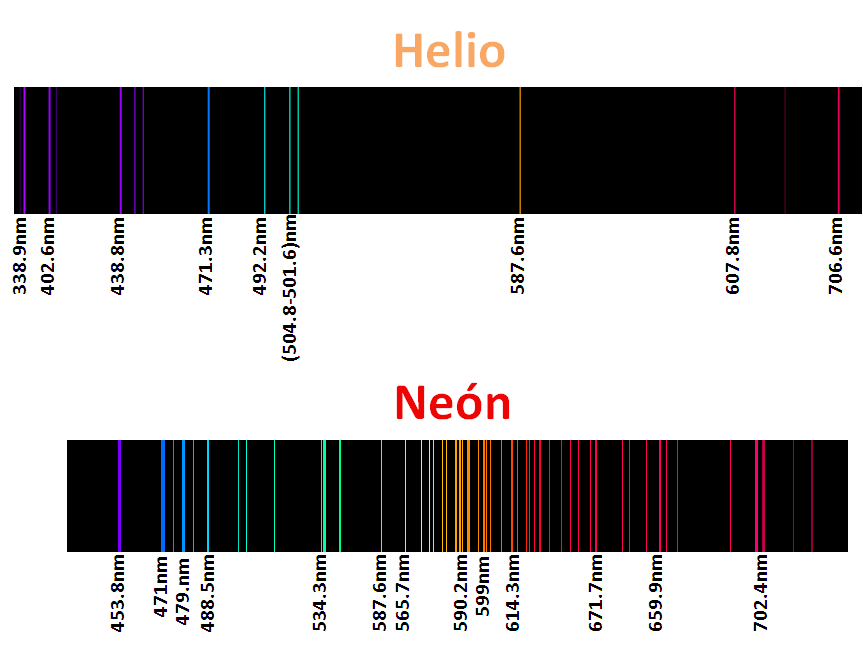
- - -
- - -
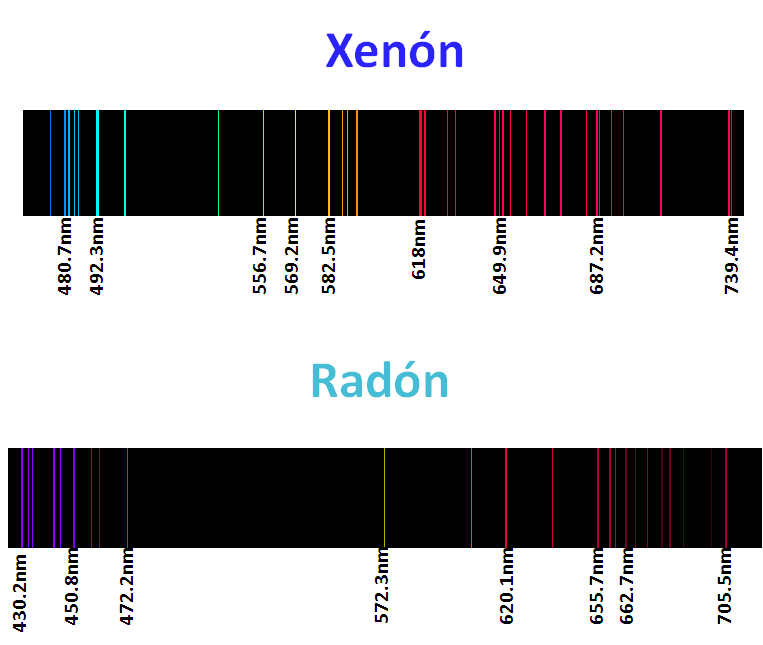
<center>_**Atomic spectra of noble gases**_</center>
The application of this technique is the basis used in astronomy to know the composition of the stars, analyzing the light recorded by the telescope, and after an extensive and meticulous study with computer programs can estimate the composition of the object of study. For me this topic was and is very interesting, because once again, we can see the effect of the particles of the quantum kingdom in our reality, which enlarges the importance of this branch of physics.
On the other hand Bohr's atomic model is an elegant representation that can be evidenced in his equations, which he did not place so as not to interfere with the subject with the mathematics that also implied deeper concepts of physics, but the important thing is that all these discoveries over time, you will find an application that can be of benefit and progress for humanity.
- - -
Spectra taken from the Atomic Spectra 1.0 program, and edited in Power point 2007
References:
ACOSTA, VIRGILIO; COWAN, CLYDE. Curso de Física Moderna. Editorial Harla, S.A., México, 1.975. Págs. 124-144. 512 pp.
ALONSO, MARCELO; FINN, EDWARD J. Física, Volumen II: Campos y Ondas. Fondo Educativo Interamericano, S.A., México, 1.976. Págs. 933-947. 1.067 pp.
EISBERT, ROBERT. Física Cuántica. Editorial Limusa, S.A., México, 1.983. Págs. 115-151. 833 pp.
</div>