<center>**Hello everyone!**</center> How are you doing? I hope everything's fine for you. Life is good right now as far as I am concerned, I have been quite busy lately and I have been enjoying every bit of it. Too many professional responsibilities and too much work that I have to get done, so it goes without saying that my time is limited. This is basically why I haven't posted another part of this ***Introduction to Cartography*** series in the last two weeks, but I am back to make it up to you today. I don't mean to waste your time though, so let's do this! **As promised in a previous [Cartography post](https://steemit.com/steemstem/@lordneroo/introduction-to-cartography-dasymetric-mapping) regarding the fundamental elements of Dasymetric mapping, this time we are going to move on to our next topic and talk about the various data visualization methods followed in order to achieve precise depiction of the natural terrestrial surface and its characteristics. In order to be able to use and present all available information efficiently, I have decided that this particular topic will be addressed in three different parts. Today we will talk about 3D Diagrams and Schematic Maps, which are two different types of Perspective Maps. Bear with me.** This paragraph is a personal note for all of you who are new to this blog; ***Introduction to Cartography*** is just an introductory series about **Cartography**, which is the art and science of creating precise 2D depictions of our 3D world. This means that I am sharing technical information that I gathered through years of research in a simplified manner, so that we can have some fun while learning something useful! There's always a high chance of learning a thing or two by reading through the parts of this series, so stay tuned!  <center>*Image Source: [pixabay.com](https://pixabay.com/el/%CE%BA%CF%8C%CF%83%CE%BC%CE%BF-%CF%87%CE%AC%CF%81%CF%84%CE%B7%CF%82-%CE%BC%CE%B1%CF%8D%CF%81%CE%BF-splash-1757412/)([CC0 Creative Commons](https://pixabay.com/el/service/terms/#usage) Author: [z0r0z](https://pixabay.com/el/users/z0r0z-2036362/))*</center> # Nature & Problems The creation of accurate depictions of the natural terrestrial surface hasalways been a rather significant issue for Engineers. The availability of quality depictions enables us to study this natural, continuous phenomenon which impacts us in all aspects of our daily routine. This is basically the primary reason why a higher level of precision is demanded when it comes to creating maps that depict the shape of the natural terrestrial surface. The need for higher quality standards is what keeps Cartographers in pursuit of the most efficient methods of creating precise depictions of the shape of the Earth, however constant development provided solutions which in return created more problems and fueled the need for further research. Let's see how. The main problem consists in the differences regarding precision between the different techniques used. The development of various different techniques and methods gave birth to some interesting conflicts. For instance, the most efficient techniques of visual representation cannot be used for the extraction of quality topographic information and vice versa, giving Cartographers some food for thought and inducing the need for the development of ways to handle those conflicting constraints. As we will see, the solution lies in the creation of various data visualization methods, which are tools that serve the purpose of combining visual and metric precision. There are fundamental differences between the various types of data visualization methods, depending on the type and the purpose of each tool. The availability of technological equipment and computers in combination with the fact that vast amounts of technical information are produced annually led to the development of powerful tools of iconographic mapping. Today we are going to take a deeper look at two different tools of data visualization that belong in the category of perspective maps. Let's start with 3D Diagrams.  <center>*Image Source: [pixabay.com](https://pixabay.com/el/%CE%B5%CE%B9%CE%BA%CE%BF%CE%BD%CE%AF%CE%B4%CE%B9%CE%BF-3d-%CF%87%CE%AC%CF%81%CF%84%CE%B7%CF%82-%CE%B3%CE%B5%CF%89%CE%BC%CE%B5%CF%84%CF%81%CE%B9%CE%BA%CE%AC-3043303/)([CC0 Creative Commons](https://pixabay.com/el/service/terms/#usage) Author: [Sharani_Ramli](https://pixabay.com/el/users/Sharani_Ramli-731298/))*</center> # 3D Diagrams The development of methods of depicting the shape of the natural terrestrial surface with precision was a rather significant issue during the 19th century. Cartographers achieved to provide solutions for this problem with the utilization of the theories of perspective geometry, which gave birth to the creation of 3D Diagrams. Those 3D maps were first used by Geologists as they enabled them to create 3D models which made it easier to analyze geological phenomena and comprehend their nature and magnitude. Cross sections were later included with upper edges that represent trasnversal sections of the model's surface; this enabled Cartographers to create visual representations of the structural relations between rock formations situated beneath the surface. Win - win. 3D Diagrams are meant to provide observers with a view of a particular section of the Earth's Crust with known dimensions. What makes 3D Diagrams so special is the fact that they can be used to represent a wide variety of information, ranging from structural to purely metric data and allowing 3D navigation beneath the model's surface. These diagrams are produced easily with the utilization of plotters nowadays, which is a process that doesn't cost much. It is also worth noting that 3D Diagrams are used by Cartographers in order to create depictions of small parts of the Earth's surface and therefore the planet's curvature is not taken into consideration at all. *The Earth is NOT FLAT by the way.* 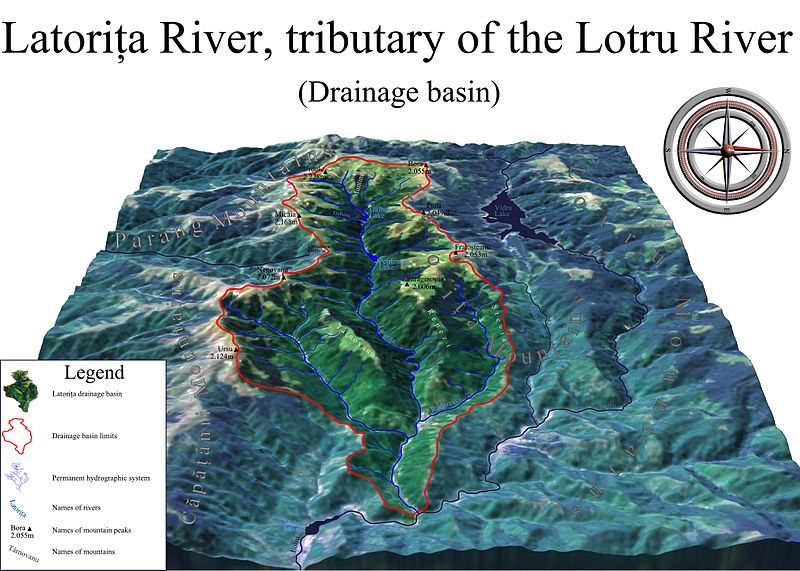 <center>*Lotru River, Drainage Basin. - 3D Diagram./ Image Source: [en.wikipedia.org](https://en.wikipedia.org/wiki/File:EN_Bazinul_hidrografic_al_Raului_Latorita,_Romania.jpg) ([Public Domain](https://en.wikipedia.org/wiki/Public_domain) Author: [NASA](https://en.wikipedia.org/wiki/NASA))*</center> # Schematic Maps Schematic maps are tools that utilize symbolic iconography in order to achieve precise depiction of the natural terrestrial surface. The primary objective is to create an efficient representation of the correlation between the shape of the natural terrestrial surface and its geological and geomorphological characteristics. This is something that can be achieved with the utilization of intensity as a primary visual variable in physiographic diagrams, however the utilization of other visual variables as well is a common phenomenon in the creation of this sort of schematic maps. Land type maps belong to the same category and are mainly used in cases when the main point of interest is the extraction of information regarding the correlations between gound formations. Physiographic diagrams and land type maps bear significant similarities and both come with an important disadvantage; there is no satisfactory accuracy regarding the 2D placement of spatial elements. This is due to the fact that any side faces of a 3D object that is observed from a side view appear to be in the wrong position on the horizontal plane. This is a problem that we have been aware of for decades and thankfully with the technological development of our times we can create digital 3D models that enable us to change view angle accordingly and focus on the spatial elements of interest. <center>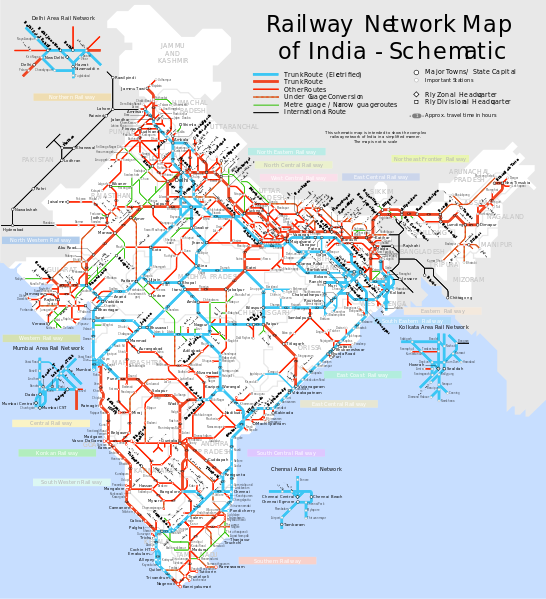</center> <center>*Railway Network Schematic Map, India - Hue used as a primary visual variable in order to represent qualitative variations./ Image Source: [commons.wikimedia.org](https://commons.wikimedia.org/wiki/File:India_railway_schematic_map.svg) ([Creative Commons](https://en.wikipedia.org/wiki/Creative_Commons) [ Attribution-Share Alike 3.0 Unported](https://creativecommons.org/licenses/by-sa/3.0/deed.en) Author: [Planemad](https://en.wikipedia.org/wiki/User:Planemad))*</center> **Alright everyone, that's it for today. Another part of my *Introduction to Cartography* series has come to an end. I got a lot more information to share with you, so make sure to follow me for more. If you do have any questions regarding anything you read here, please do let me know in the comments section below and I will do my best to provide prompt and detailed answers. More Engineering stuff regarding Cartography and Geology coming out within the next days, so stay tuned and follow me for more!** # PREVIOUS PARTS OF THE SERIES: 1. [INTRODUCTION TO CARTOGRAPHY](https://steemit.com/engineering/@lordneroo/introduction-to-cartography) 2. [CLASSIFICATION & BROAD CATEGORIES](https://steemit.com/engineering/@lordneroo/introduction-to-cartography-classification-and-broad-categories) 3. [CARTOGRAPHIC TRANSFORMATIONS](https://steemit.com/steemstem/@lordneroo/introduction-to-cartography-cartographic-transformations) 4. [CONFORMAL PROJECTIONS](https://steemit.com/steemstem/@lordneroo/introduction-to-cartography-conformal-projections) 5. [EQUAL AREA PROJECTIONS](https://steemit.com/steemstem/@lordneroo/introduction-to-cartography-equal-area-projections) 6. [AZIMUTHAL PROJECTIONS](https://steemit.com/steemstem/@lordneroo/introduction-to-cartography-azimuthal-projections) 7. [SCALE FACTOR & TRANSFORMATION](https://steemit.com/steemstem/@lordneroo/introduction-to-cartography-scale-factor-and-transformation) 8. [CARTESIAN COORDINATES & GRID SYSTEMS](https://steemit.com/steemstem/@lordneroo/introduction-to-cartography-cartesian-coordinates-and-grid-systems) 9. [3D COLOR SPACE](https://steemit.com/steemstem/@lordneroo/introduction-to-cartography-3d-color-space) 10. [COLOR SYSTEMS](https://steemit.com/steemstem/@lordneroo/introduction-to-cartography-color-systems) 11. [COLOR & PATTERN IN SYMBOLIZATION (Part I)](https://steemit.com/steemstem/@lordneroo/introduction-to-cartography-color-and-pattern-in-symbolism-part-i) 12. [COLOR & PATTERN IN SYMBOLIZATION (Part II)](https://steemit.com/steemstem/@lordneroo/introduction-to-cartography-color-and-pattern-in-symbolism-part-ii) 13. [CARTOGRAPHIC SYMBOLIZATION & VISUAL VARIABLES](https://steemit.com/steemstem/@lordneroo/introduction-to-cartography-cartographic-symbolization-and-visual-variables) 14. [SYMBOLIZING POINT DATA](https://steemit.com/steemstem/@lordneroo/introduction-to-cartography-symbolizing-point-data) 15. [SYMBOLIZING LINEAR DATA](https://steemit.com/steemstem/@lordneroo/introduction-to-cartography-symbolizing-linear-data) 16. [SYMBOLIZING SURFACE DATA](https://steemit.com/steemstem/@lordneroo/introduction-to-cartography-symbolizing-surface-data) 17. [SYMBOLIZING VOLUMETRIC DATA](https://steemit.com/steemstem/@lordneroo/introduction-to-cartgoraphy-symbolizing-volumetric-data) 18. [STATISTICAL SURFACE & POINT SYMBOLS](https://steemit.com/steemstem/@lordneroo/introduction-to-cartography-statistical-surface-and-point-symbols) 19. [STATISTICAL SURFACE & LINEAR SYMBOLS](https://steemit.com/steemstem/@lordneroo/introduction-to-cartography-statistical-surface-and-linear-symbols) 20. [ISARITHMIC MAPPING](https://steemit.com/steemstem/@lordneroo/introduction-to-cartography-isarithmic-mapping) 21. [ELEMENTS OF ISARITHMIC MAPPING](https://steemit.com/steemstem/@lordneroo/introduction-to-cartography-elements-of-isarithmic-mapping) 22. [ISARITHMIC ANALYSIS](https://steemit.com/steemstem/@lordneroo/introduction-to-cartography-isarithmic-analysis) 23. [CHOROPLETH MAPPING](https://steemit.com/steemstem/@lordneroo/introduction-to-cartography-choropleth-mapping) 24. [ELEMENTS OF CHOROPLETH MAPPING](https://steemit.com/steemstem/@lordneroo/introduction-to-cartography-elements-of-choropleth-mapping) 25. [DASYMETRIC MAPPING](https://steemit.com/steemstem/@lordneroo/introduction-to-cartography-dasymetric-mapping)  **IMAGE SOURCES:** - [pixabay.com](www.pixabay.com) - [commons.wikimedia.org](https://commons.wikimedia.org) **REFERENCES:** ***University Textbooks & Course Lectures:*** - Χαρτογραφία Ι/ Cartography I -TSOULOS(National Technical University of Athens, School of Rural & Surveying Engineering, Course Lecture Notes) ***Internet Links:*** - https://pubs.usgs.gov/tm/2005/11B01/05tm11b01.html - https://ieeexplore.ieee.org/document/575833/ - https://link.springer.com/article/10.1007/s12665-010-0480-z - https://prism.ucalgary.ca/bitstream/handle/1880/45758/2001-693-16.pdf?sequence=2&isAllowed=y - https://link.springer.com/article/10.1007/BF03036796 - https://www.environment.nsw.gov.au/topics/land-and-soil/information/soil-maps https://cdn.steemitimages.com/DQmRPE1XvcHNHHRD1g5aThwFop2fXAZxrdy198gNH7T86zK/STEEMSTEM-bygtg.gif <sub><center>**Video Credits @gtg**</center> <center>**GIF by @katerinaramm**</center></sub>  <sub><center>**Image by @ruth-girl**</center></sub>  <center>**Thank you for your attention!**</center> <center>**Hope you enjoyed this post and did learn a thing or two.**</center> <center>**Follow me and stay tuned for more engineering blogs.**</center> <center>**Highest Regards**</center> <center>**@lordneroo**</center>
| author | lordneroo |
|---|---|
| permlink | introduction-to-cartography-data-visualization-methods-part-i |
| category | steemstem |
| json_metadata | {"links":["https://steemit.com/steemstem/@lordneroo/introduction-to-cartography-dasymetric-mapping","https://pixabay.com/el/%CE%BA%CF%8C%CF%83%CE%BC%CE%BF-%CF%87%CE%AC%CF%81%CF%84%CE%B7%CF%82-%CE%BC%CE%B1%CF%8D%CF%81%CE%BF-splash-1757412/","https://pixabay.com/el/service/terms/#usage","https://pixabay.com/el/users/z0r0z-2036362/","https://pixabay.com/el/%CE%B5%CE%B9%CE%BA%CE%BF%CE%BD%CE%AF%CE%B4%CE%B9%CE%BF-3d-%CF%87%CE%AC%CF%81%CF%84%CE%B7%CF%82-%CE%B3%CE%B5%CF%89%CE%BC%CE%B5%CF%84%CF%81%CE%B9%CE%BA%CE%AC-3043303/","https://pixabay.com/el/users/Sharani_Ramli-731298/","https://en.wikipedia.org/wiki/File:EN_Bazinul_hidrografic_al_Raului_Latorita,_Romania.jpg","https://en.wikipedia.org/wiki/Public_domain","https://en.wikipedia.org/wiki/NASA","https://commons.wikimedia.org/wiki/File:India_railway_schematic_map.svg","https://en.wikipedia.org/wiki/Creative_Commons","https://creativecommons.org/licenses/by-sa/3.0/deed.en","https://en.wikipedia.org/wiki/User:Planemad","https://steemit.com/engineering/@lordneroo/introduction-to-cartography","https://steemit.com/engineering/@lordneroo/introduction-to-cartography-classification-and-broad-categories","https://steemit.com/steemstem/@lordneroo/introduction-to-cartography-cartographic-transformations","https://steemit.com/steemstem/@lordneroo/introduction-to-cartography-conformal-projections","https://steemit.com/steemstem/@lordneroo/introduction-to-cartography-equal-area-projections","https://steemit.com/steemstem/@lordneroo/introduction-to-cartography-azimuthal-projections","https://steemit.com/steemstem/@lordneroo/introduction-to-cartography-scale-factor-and-transformation","https://steemit.com/steemstem/@lordneroo/introduction-to-cartography-cartesian-coordinates-and-grid-systems","https://steemit.com/steemstem/@lordneroo/introduction-to-cartography-3d-color-space","https://steemit.com/steemstem/@lordneroo/introduction-to-cartography-color-systems","https://steemit.com/steemstem/@lordneroo/introduction-to-cartography-color-and-pattern-in-symbolism-part-i","https://steemit.com/steemstem/@lordneroo/introduction-to-cartography-color-and-pattern-in-symbolism-part-ii","https://steemit.com/steemstem/@lordneroo/introduction-to-cartography-cartographic-symbolization-and-visual-variables","https://steemit.com/steemstem/@lordneroo/introduction-to-cartography-symbolizing-point-data","https://steemit.com/steemstem/@lordneroo/introduction-to-cartography-symbolizing-linear-data","https://steemit.com/steemstem/@lordneroo/introduction-to-cartography-symbolizing-surface-data","https://steemit.com/steemstem/@lordneroo/introduction-to-cartgoraphy-symbolizing-volumetric-data","https://steemit.com/steemstem/@lordneroo/introduction-to-cartography-statistical-surface-and-point-symbols","https://steemit.com/steemstem/@lordneroo/introduction-to-cartography-statistical-surface-and-linear-symbols","https://steemit.com/steemstem/@lordneroo/introduction-to-cartography-isarithmic-mapping","https://steemit.com/steemstem/@lordneroo/introduction-to-cartography-elements-of-isarithmic-mapping","https://steemit.com/steemstem/@lordneroo/introduction-to-cartography-isarithmic-analysis","https://steemit.com/steemstem/@lordneroo/introduction-to-cartography-choropleth-mapping","https://steemit.com/steemstem/@lordneroo/introduction-to-cartography-elements-of-choropleth-mapping","www.pixabay.com","https://commons.wikimedia.org","https://pubs.usgs.gov/tm/2005/11B01/05tm11b01.html","https://ieeexplore.ieee.org/document/575833/","https://link.springer.com/article/10.1007/s12665-010-0480-z","https://prism.ucalgary.ca/bitstream/handle/1880/45758/2001-693-16.pdf?sequence=2&isAllowed=y","https://link.springer.com/article/10.1007/BF03036796","https://www.environment.nsw.gov.au/topics/land-and-soil/information/soil-maps"],"users":["gtg","katerinaramm","ruth-girl","lordneroo"],"app":"steemit/0.1","image":["https://cdn.steemitimages.com/DQmfQX5EgtyTkY1hWg4JWBq891AHAhsVunNpDTaSE4pUeKU/world-1757412_960_720.jpg","https://cdn.steemitimages.com/DQmTzJUku3PB6ZGwSKKJX6eJHrnn1nLgNTiWgbA4iUJnN8G/icon-3043303_960_720.jpg","https://cdn.steemitimages.com/DQmTyVP8jceHLkfSstMEeJUiQ6UrHmfEr8Sz4KYWwir81aG/800px-EN_Bazinul_hidrografic_al_Raului_Latorita,_Romania.jpg","https://cdn.steemitimages.com/DQmRdwn3ST4hUtiTEf2ofvgRAzhFn2PuvgqjNmRG9sDH7Jt/546px-India_railway_schematic_map.svg.png","https://steemitimages.com/DQmTjUEWdmEvtQcJMueV3YTGnHVNweSGbfDAAEVnCRGPJm4/DQmQPRBLmhWag36FBxYVNJNKZRUsBbpPeZvm7FVixnWVXhk_1680x8400.png","https://cdn.steemitimages.com/DQmRPE1XvcHNHHRD1g5aThwFop2fXAZxrdy198gNH7T86zK/STEEMSTEM-bygtg.gif","https://cdn.steemitimages.com/DQmVoFU6RW8C3goVZ2XeKRRvfstRT48hoH7w6MFBH6ua82M/dKb6WbRv-image.png"],"tags":["steemstem","engineering","busy","science","davinci-times"],"community":"busy","format":"markdown"} |
| created | 2018-11-01 23:23:33 |
| last_update | 2019-07-24 12:56:06 |
| depth | 0 |
| children | 14 |
| last_payout | 2018-11-08 23:23:33 |
| cashout_time | 1969-12-31 23:59:59 |
| total_payout_value | 5.980 HBD |
| curator_payout_value | 1.740 HBD |
| pending_payout_value | 0.000 HBD |
| promoted | 0.000 HBD |
| body_length | 14,426 |
| author_reputation | 266,559,244,769,431 |
| root_title | "INTRODUCTION TO CARTOGRAPHY - DATA VISUALIZATION METHODS" |
| beneficiaries | [] |
| max_accepted_payout | 1,000,000.000 HBD |
| percent_hbd | 10,000 |
| post_id | 74,506,923 |
| net_rshares | 6,966,452,345,805 |
| author_curate_reward | "" |
| voter | weight | wgt% | rshares | pct | time |
|---|---|---|---|---|---|
| wackou | 0 | 69,079,058,585 | 1.07% | ||
| lafona-miner | 0 | 905,158,783,199 | 20% | ||
| tombstone | 0 | 178,136,904,211 | 0.8% | ||
| tuck-fheman | 0 | 446,836,297 | 1.79% | ||
| kevinwong | 0 | 140,047,906,356 | 2% | ||
| anwenbaumeister | 0 | 149,277,293 | 3.59% | ||
| mammasitta | 0 | 16,423,640,358 | 5% | ||
| mrwang | 0 | 285,251,956 | 1% | ||
| raymondspeaks | 0 | 533,118,388 | 1.79% | ||
| arcange | 0 | 24,262,682,861 | 4% | ||
| arconite | 0 | 555,753,454 | 1% | ||
| raphaelle | 0 | 1,778,142,048 | 4% | ||
| lemouth | 0 | 74,515,702,363 | 15% | ||
| charlie777pt | 0 | 371,198,544 | 0.35% | ||
| lamouthe | 0 | 7,957,161,040 | 20% | ||
| lk666 | 0 | 410,648,614 | 1.79% | ||
| eforucom | 0 | 3,016,295,227 | 1.04% | ||
| curie | 0 | 98,236,553,859 | 3.59% | ||
| busy.pay | 0 | 177,288,679,007 | 0.86% | ||
| hendrikdegrote | 0 | 1,670,489,901,277 | 3.59% | ||
| vact | 0 | 66,422,488,167 | 3.59% | ||
| steemstem | 0 | 838,425,812,649 | 20% | ||
| dashfit | 0 | 289,288,984 | 1.79% | ||
| gangstayid | 0 | 71,706,492 | 1.79% | ||
| dna-replication | 0 | 5,553,695,245 | 20% | ||
| dimitrisp | 0 | 19,313,493,787 | 50% | ||
| filotasriza3 | 0 | 11,878,655,953 | 20% | ||
| gmedley | 0 | 215,104,330 | 1.79% | ||
| evimeria | 0 | 8,445,529,363 | 100% | ||
| hagbardceline | 0 | 155,710,921,233 | 100% | ||
| pacokam8 | 0 | 144,117,198 | 1.43% | ||
| lordneroo | 0 | 20,100,367,160 | 100% | ||
| moksamol | 0 | 349,845,844 | 1.79% | ||
| getrichordie | 0 | 84,675,586 | 1.79% | ||
| bloom | 0 | 80,673,810,932 | 20% | ||
| iansart | 0 | 1,396,013,149 | 1.79% | ||
| kryzsec | 0 | 11,237,928,383 | 16% | ||
| jiujitsu | 0 | 2,516,358,334 | 1.79% | ||
| jga | 0 | 1,997,136,472 | 8.5% | ||
| greek-trail | 0 | 20,160,608,842 | 40% | ||
| yehey | 0 | 17,692,956,459 | 10% | ||
| helo | 0 | 3,242,259,943 | 10% | ||
| mariossap | 0 | 7,102,991,022 | 100% | ||
| samminator | 0 | 5,608,780,162 | 10% | ||
| catchawhale | 0 | 5,348,412,843 | 5% | ||
| locikll | 0 | 1,331,066,526 | 7.18% | ||
| mahdiyari | 0 | 14,941,694,936 | 10% | ||
| aboutyourbiz | 0 | 596,845,076 | 3.59% | ||
| alexander.alexis | 0 | 6,785,775,597 | 20% | ||
| suesa | 0 | 91,400,297,103 | 25% | ||
| rival | 0 | 1,611,787,559 | 1% | ||
| sensation | 0 | 275,186,241 | 100% | ||
| slickhustler007 | 0 | 121,639,607 | 1.79% | ||
| corsica | 0 | 8,742,770,436 | 20% | ||
| ruth-girl | 0 | 294,170,748,232 | 100% | ||
| trenz | 0 | 1,043,759,386 | 1.43% | ||
| ludmila.kyriakou | 0 | 254,933,902 | 6% | ||
| fancybrothers | 0 | 3,476,997,593 | 6% | ||
| howo | 0 | 25,685,768,953 | 10% | ||
| tsoldovieri | 0 | 1,076,240,188 | 10% | ||
| nitego | 0 | 293,068,281 | 1.07% | ||
| bachuslib | 0 | 20,792,176,955 | 100% | ||
| neumannsalva | 0 | 365,494,498 | 1.79% | ||
| wargof | 0 | 338,082,448 | 10% | ||
| abigail-dantes | 0 | 687,279,117,602 | 50% | ||
| esteemguy | 0 | 137,330,386 | 20% | ||
| g0nr0gue | 0 | 138,373,906 | 1.79% | ||
| alexzicky | 0 | 2,901,325,901 | 5% | ||
| mountain.phil28 | 0 | 3,544,799,794 | 25% | ||
| kingswisdom | 0 | 296,298,988 | 10% | ||
| zest | 0 | 3,571,096,633 | 10% | ||
| felixrodriguez | 0 | 776,112,489 | 10% | ||
| indy8phish | 0 | 118,343,731 | 1.79% | ||
| azulear | 0 | 71,404,956 | 1.79% | ||
| honeysara | 0 | 128,487,950 | 0.89% | ||
| mr-aaron | 0 | 432,877,430 | 10% | ||
| massivevibration | 0 | 2,554,771,194 | 5% | ||
| nurhayati | 0 | 321,970,051 | 1% | ||
| fbslo | 0 | 5,393,769,922 | 2% | ||
| accelerator | 0 | 17,446,558,695 | 1.3% | ||
| clweeks | 0 | 165,237,062 | 2.15% | ||
| torico | 0 | 297,500,077 | 0.89% | ||
| nicola71 | 0 | 1,547,584,271 | 3.5% | ||
| damzxyno | 0 | 196,823,855 | 4% | ||
| magnata | 0 | 183,131,030 | 1.79% | ||
| espoem | 0 | 1,688,417,363 | 1% | ||
| erikkun28 | 0 | 0 | 1% | ||
| gotgame | 0 | 82,720,941 | 1.79% | ||
| jlsplatts | 0 | 115,066,436 | 0.71% | ||
| poodai | 0 | 101,408,427 | 1.79% | ||
| peaceandwar | 0 | 424,768,261 | 1.79% | ||
| enzor | 0 | 250,075,898 | 10% | ||
| jesusj1 | 0 | 60,343,128 | 100% | ||
| delin.english | 0 | 209,703,615 | 10% | ||
| katamori | 0 | 547,748,683 | 8.5% | ||
| tfcoates | 0 | 371,780,906 | 5% | ||
| katerinaramm | 0 | 31,454,299,855 | 100% | ||
| janine-ariane | 0 | 57,224,325 | 5% | ||
| drmake | 0 | 1,683,277,148 | 1.79% | ||
| aboutcoolscience | 0 | 20,810,112,616 | 22% | ||
| guga34 | 0 | 480,779,513 | 15% | ||
| xanderslee | 0 | 158,674,643 | 3.59% | ||
| egotheist | 0 | 138,892,161 | 2% | ||
| kenadis | 0 | 2,633,550,582 | 10% | ||
| robotics101 | 0 | 1,842,440,925 | 20% | ||
| tristan-muller | 0 | 78,794,715 | 20% | ||
| alexs1320 | 0 | 14,215,288,814 | 18% | ||
| gentleshaid | 0 | 4,505,864,129 | 10% | ||
| andyblack | 0 | 11,998,286,261 | 50% | ||
| thescubageek | 0 | 179,361,042 | 1.79% | ||
| fejiro | 0 | 208,762,729 | 10% | ||
| venalbe | 0 | 71,399,017 | 1.79% | ||
| sco | 0 | 14,620,797,455 | 18% | ||
| anikekirsten | 0 | 172,976,312 | 3.59% | ||
| hkmoon | 0 | 204,053,968 | 1.79% | ||
| rharphelle | 0 | 1,024,444,006 | 25% | ||
| gordon92 | 0 | 94,768,179 | 1.79% | ||
| stahlberg | 0 | 606,697,152 | 1.79% | ||
| catalincernat | 0 | 166,807,038 | 3.59% | ||
| reizak | 0 | 243,159,585 | 1.43% | ||
| dedicatedguy | 0 | 151,323,582,896 | 100% | ||
| zlatkamrs | 0 | 146,715,926 | 3.41% | ||
| shoganaii | 0 | 137,483,613 | 10% | ||
| samve | 0 | 6,572,925,956 | 100% | ||
| darkiche | 0 | 76,184,945 | 10% | ||
| hetty-rowan | 0 | 110,622,224 | 1.79% | ||
| ydavgonzalez | 0 | 8,352,381,473 | 100% | ||
| jesusjacr | 0 | 369,590,139 | 0.34% | ||
| langford | 0 | 9,295,585,702 | 20% | ||
| laritheghost | 0 | 93,276,571 | 1.79% | ||
| ismailkah | 0 | 21,674,383,246 | 75% | ||
| mathowl | 0 | 4,906,384,073 | 14% | ||
| adamzi | 0 | 67,881,976 | 1.79% | ||
| lacher-prise | 0 | 164,483,920 | 10% | ||
| terrylovejoy | 0 | 34,461,080,871 | 100% | ||
| thabiggdogg | 0 | 424,813,854 | 1.79% | ||
| olajidekehinde | 0 | 81,448,777 | 10% | ||
| real2josh | 0 | 152,558,711 | 10% | ||
| giddyupngo | 0 | 79,093,933 | 1.79% | ||
| steepup | 0 | 278,037,451 | 8% | ||
| gribouille | 0 | 191,899,779 | 10% | ||
| neokuduk | 0 | 1,321,005,998 | 100% | ||
| traviseric | 0 | 241,924,967 | 50% | ||
| mininthecity | 0 | 97,593,775 | 2.87% | ||
| literaturk | 0 | 440,394,710 | 100% | ||
| mondodidave73 | 0 | 1,464,688,075 | 3% | ||
| kingabesh | 0 | 597,361,035 | 10% | ||
| didic | 0 | 1,199,956,611 | 1.79% | ||
| niko3d | 0 | 87,446,045 | 1.79% | ||
| simoneg | 0 | 515,040,223 | 24% | ||
| operahoser | 0 | 189,059,611 | 0.57% | ||
| dexterdev | 0 | 749,329,509 | 10% | ||
| tkappa | 0 | 75,725,560,844 | 100% | ||
| nwjordan | 0 | 454,668,404 | 3.59% | ||
| oghie | 0 | 500,743,243 | 50% | ||
| geopolis | 0 | 1,448,238,898 | 10% | ||
| robertbira | 0 | 9,821,301,873 | 25% | ||
| eliakon | 0 | 53,477,914,197 | 100% | ||
| ajpacheco1610 | 0 | 280,620,810 | 10% | ||
| alinak15 | 0 | 36,979,672,261 | 100% | ||
| alexdory | 0 | 7,576,977,821 | 8% | ||
| vegan.niinja | 0 | 186,463,055 | 1.79% | ||
| liberviarum | 0 | 6,446,149,746 | 100% | ||
| benleemusic | 0 | 667,697,911 | 0.35% | ||
| lianaakobian | 0 | 2,280,286,039 | 20% | ||
| tbouras | 0 | 88,690,260 | 50% | ||
| akifane | 0 | 512,290,505 | 100% | ||
| francostem | 0 | 1,555,969,516 | 20% | ||
| rasit | 0 | 440,464,661 | 100% | ||
| ivan-g | 0 | 340,056,841 | 1.79% | ||
| chimtivers96 | 0 | 105,733,081 | 3.59% | ||
| sissyjill | 0 | 71,868,152 | 7% | ||
| deusjudo | 0 | 821,675,679 | 3.5% | ||
| emmanuel293 | 0 | 91,220,406 | 25% | ||
| morbyjohn | 0 | 126,928,868 | 7% | ||
| anyes2013 | 0 | 190,773,229 | 10% | ||
| maveraunnehr | 0 | 394,665,481 | 100% | ||
| wanasoloben | 0 | 174,062,269 | 1.79% | ||
| lesmouths-travel | 0 | 885,540,184 | 15% | ||
| jacksartori | 0 | 70,060,240,632 | 80% | ||
| effofex | 0 | 856,912,193 | 5% | ||
| suntree | 0 | 3,405,694,650 | 100% | ||
| eniolw | 0 | 2,091,361,454 | 50% | ||
| de-stem | 0 | 12,712,921,898 | 19.8% | ||
| serylt | 0 | 5,521,477,046 | 19.6% | ||
| angelinafx | 0 | 1,345,423,743 | 1% | ||
| ari16 | 0 | 223,169,531 | 10% | ||
| qurator-tier-0 | 0 | 5,106,211,121 | 3.5% | ||
| outtheshellvlog | 0 | 1,516,322,346 | 50% | ||
| trufflepig | 0 | 33,379,387,479 | 34% | ||
| michaelwrites | 0 | 228,650,569 | 10% | ||
| deholt | 0 | 665,225,137 | 20% | ||
| solominer | 0 | 845,745,319 | 2.5% | ||
| temitayo-pelumi | 0 | 1,480,237,620 | 20% | ||
| alexworld | 0 | 386,071,848 | 25% | ||
| marcuz | 0 | 368,293,577 | 10% | ||
| beetlevc | 0 | 1,195,206,328 | 2% | ||
| niouton | 0 | 136,034,243 | 0.71% | ||
| cosmophobia | 0 | 152,160,990 | 1.79% | ||
| merlion | 0 | 999,518,478 | 1% | ||
| steemzeiger | 0 | 909,559,612 | 19.8% | ||
| council | 0 | 622,202,981 | 10% | ||
| sbi5 | 0 | 17,077,309,037 | 8% | ||
| cryptouru | 0 | 1,803,263,700 | 8.5% | ||
| minasyanvahe | 0 | 538,224,350 | 100% | ||
| biomimi | 0 | 188,095,066 | 40% | ||
| viktorzarubin | 0 | 537,772,799 | 100% | ||
| ibk-gabriel | 0 | 121,381,454 | 10% | ||
| drsensor | 0 | 1,458,335,957 | 12% | ||
| noobster | 0 | 889,630,301 | 100% | ||
| reyvaj | 0 | 258,828,178 | 10% | ||
| ilovecryptopl | 0 | 303,964,085 | 2.87% | ||
| purelyscience | 0 | 117,156,409 | 10% | ||
| yomismosoy | 0 | 169,570,552 | 50% | ||
| yestermorrow | 0 | 119,967,856 | 5.1% | ||
| call-me-howie | 0 | 1,873,456,455 | 1.79% | ||
| hansmast | 0 | 234,725,962 | 1.79% | ||
| zuerich | 0 | 181,793,942,480 | 100% | ||
| wstanley226 | 0 | 3,189,253,359 | 50% | ||
| gpcx86 | 0 | 279,156,587 | 5% | ||
| teneresa | 0 | 1,563,472,556 | 100% | ||
| osariemen | 0 | 1,529,857,988 | 90% | ||
| molypap | 0 | 555,234,866 | 100% | ||
| statgen | 0 | 1,188,198,805 | 7.9% | ||
| perpetuum-lynx | 0 | 378,581,740 | 19.6% | ||
| meme.nation | 0 | 505,858,206 | 8.5% | ||
| herbayomi | 0 | 232,999,558 | 10% | ||
| annaabi | 0 | 269,416,725 | 1.79% | ||
| lecongdoo3 | 0 | 15,471,490,954 | 100% | ||
| fuzzythumb | 0 | 671,906,437 | 100% | ||
| skorup87 | 0 | 16,697,780 | 11% | ||
| trang | 0 | 266,608,250 | 1.79% | ||
| kanhiyachauhan | 0 | 162,495,825 | 1.79% | ||
| rhethypo | 0 | 113,028,840 | 1.79% | ||
| predict-crypto | 0 | 92,246,340 | 0.07% | ||
| savelyev.dima | 0 | 540,676,958 | 100% | ||
| devsup | 0 | 2,775,317,891 | 0.69% | ||
| yassinebad | 0 | 14,017,774,249 | 75% | ||
| philipkavan | 0 | 217,668,383 | 10% | ||
| akireuna | 0 | 14,610,440,977 | 70% | ||
| leyt | 0 | 2,491,722,613 | 75% | ||
| ahmedess | 0 | 3,925,240,084 | 75% | ||
| nfc | 0 | 11,751,122,963 | 1% | ||
| stem.witness | 0 | 2,170,846,908 | 20% | ||
| sarhugo | 0 | 100,234,474 | 1.79% | ||
| dgamez | 0 | 449,032,761 | 100% | ||
| mkgfabo | 0 | 20,572,076,389 | 100% | ||
| gemgoosander | 0 | 542,699,507 | 100% | ||
| butanecomment | 0 | 542,553,150 | 100% | ||
| bitok.xyz | 0 | 17,769,368,980 | 2% | ||
| aristotle.team | 0 | 62,309,719,478 | 100% | ||
| kingnosa | 0 | 27,913,005 | 50% | ||
| titoncp | 0 | 78,338,570 | 82% | ||
| whitebot | 0 | 19,475,437,742 | 1% | ||
| aristotle.pay | 0 | 535,664,347 | 100% | ||
| chrnerd | 0 | 421,438,558 | 100% |
Love Cartography @lordneroo 🙂
| author | alinak15 |
|---|---|
| permlink | re-lordneroo-introduction-to-cartography-data-visualization-methods-part-i-20181102t160221555z |
| category | steemstem |
| json_metadata | {"tags":["steemstem"],"users":["lordneroo"],"app":"steemit/0.1"} |
| created | 2018-11-02 16:02:33 |
| last_update | 2018-11-02 16:02:33 |
| depth | 1 |
| children | 1 |
| last_payout | 2018-11-09 16:02:33 |
| cashout_time | 1969-12-31 23:59:59 |
| total_payout_value | 0.017 HBD |
| curator_payout_value | 0.005 HBD |
| pending_payout_value | 0.000 HBD |
| promoted | 0.000 HBD |
| body_length | 29 |
| author_reputation | 10,228,393,279,046 |
| root_title | "INTRODUCTION TO CARTOGRAPHY - DATA VISUALIZATION METHODS" |
| beneficiaries | [] |
| max_accepted_payout | 1,000,000.000 HBD |
| percent_hbd | 10,000 |
| post_id | 74,551,355 |
| net_rshares | 20,764,607,816 |
| author_curate_reward | "" |
| voter | weight | wgt% | rshares | pct | time |
|---|---|---|---|---|---|
| lordneroo | 0 | 20,764,607,816 | 100% |
Me too! Thanks for passing by @alinak15, have a good day!
| author | lordneroo |
|---|---|
| permlink | re-alinak15-re-lordneroo-introduction-to-cartography-data-visualization-methods-part-i-20181102t161939998z |
| category | steemstem |
| json_metadata | {"tags":["steemstem"],"users":["alinak15"],"app":"steemit/0.1"} |
| created | 2018-11-02 16:19:42 |
| last_update | 2018-11-02 16:19:42 |
| depth | 2 |
| children | 0 |
| last_payout | 2018-11-09 16:19:42 |
| cashout_time | 1969-12-31 23:59:59 |
| total_payout_value | 0.000 HBD |
| curator_payout_value | 0.000 HBD |
| pending_payout_value | 0.000 HBD |
| promoted | 0.000 HBD |
| body_length | 57 |
| author_reputation | 266,559,244,769,431 |
| root_title | "INTRODUCTION TO CARTOGRAPHY - DATA VISUALIZATION METHODS" |
| beneficiaries | [] |
| max_accepted_payout | 1,000,000.000 HBD |
| percent_hbd | 10,000 |
| post_id | 74,552,155 |
| net_rshares | 0 |
<center>Your post has been read and you did great! You received a 10.0% upvote from us for your post since you are not yet a member of the geopolis community. You are always welcome to join us and get more recognition for your posts. You can find more information about geopolis [here](https://steemit.com/geopolis/@geopolis/geopolis-the-community-for-global-sciences-update-4) or join our [Discord server](https://discordapp.com/invite/HtyHbZf). [](https://steemit.com/geopolis/@geopolis/geopolis-the-community-for-global-sciences-update-4) </center>
| author | geopolis |
|---|---|
| permlink | re-introduction-to-cartography-data-visualization-methods-part-i-20181102t070312z |
| category | steemstem |
| json_metadata | "{"app": "beem/0.20.9"}" |
| created | 2018-11-02 07:03:21 |
| last_update | 2018-11-02 07:03:21 |
| depth | 1 |
| children | 1 |
| last_payout | 2018-11-09 07:03:21 |
| cashout_time | 1969-12-31 23:59:59 |
| total_payout_value | 0.000 HBD |
| curator_payout_value | 0.000 HBD |
| pending_payout_value | 0.000 HBD |
| promoted | 0.000 HBD |
| body_length | 635 |
| author_reputation | 1,932,410,361,288 |
| root_title | "INTRODUCTION TO CARTOGRAPHY - DATA VISUALIZATION METHODS" |
| beneficiaries | [] |
| max_accepted_payout | 1,000,000.000 HBD |
| percent_hbd | 10,000 |
| post_id | 74,525,236 |
| net_rshares | 0 |
Thank you for the support!
| author | lordneroo |
|---|---|
| permlink | re-geopolis-re-introduction-to-cartography-data-visualization-methods-part-i-20181102t070312z-20181102t145125433z |
| category | steemstem |
| json_metadata | {"tags":["steemstem"],"app":"steemit/0.1"} |
| created | 2018-11-02 14:51:27 |
| last_update | 2018-11-02 14:51:27 |
| depth | 2 |
| children | 0 |
| last_payout | 2018-11-09 14:51:27 |
| cashout_time | 1969-12-31 23:59:59 |
| total_payout_value | 0.000 HBD |
| curator_payout_value | 0.000 HBD |
| pending_payout_value | 0.000 HBD |
| promoted | 0.000 HBD |
| body_length | 26 |
| author_reputation | 266,559,244,769,431 |
| root_title | "INTRODUCTION TO CARTOGRAPHY - DATA VISUALIZATION METHODS" |
| beneficiaries | [] |
| max_accepted_payout | 1,000,000.000 HBD |
| percent_hbd | 10,000 |
| post_id | 74,547,341 |
| net_rshares | 0 |
Nice to see you back to Cartography :)
| author | katerinaramm |
|---|---|
| permlink | re-lordneroo-introduction-to-cartography-data-visualization-methods-part-i-20181102t062817300z |
| category | steemstem |
| json_metadata | {"tags":["steemstem"],"app":"steemit/0.1"} |
| created | 2018-11-02 06:28:21 |
| last_update | 2018-11-02 06:28:21 |
| depth | 1 |
| children | 1 |
| last_payout | 2018-11-09 06:28:21 |
| cashout_time | 1969-12-31 23:59:59 |
| total_payout_value | 0.022 HBD |
| curator_payout_value | 0.007 HBD |
| pending_payout_value | 0.000 HBD |
| promoted | 0.000 HBD |
| body_length | 38 |
| author_reputation | 679,519,167,265,130 |
| root_title | "INTRODUCTION TO CARTOGRAPHY - DATA VISUALIZATION METHODS" |
| beneficiaries | [] |
| max_accepted_payout | 1,000,000.000 HBD |
| percent_hbd | 10,000 |
| post_id | 74,523,885 |
| net_rshares | 27,446,516,374 |
| author_curate_reward | "" |
| voter | weight | wgt% | rshares | pct | time |
|---|---|---|---|---|---|
| lordneroo | 0 | 23,098,284,659 | 100% | ||
| steemkitten | 0 | 4,348,231,715 | 100% |
<3 Have a great day!
| author | lordneroo |
|---|---|
| permlink | re-katerinaramm-re-lordneroo-introduction-to-cartography-data-visualization-methods-part-i-20181102t123458479z |
| category | steemstem |
| json_metadata | {"tags":["steemstem"],"app":"steemit/0.1"} |
| created | 2018-11-02 12:35:00 |
| last_update | 2018-11-02 12:35:00 |
| depth | 2 |
| children | 0 |
| last_payout | 2018-11-09 12:35:00 |
| cashout_time | 1969-12-31 23:59:59 |
| total_payout_value | 0.000 HBD |
| curator_payout_value | 0.000 HBD |
| pending_payout_value | 0.000 HBD |
| promoted | 0.000 HBD |
| body_length | 20 |
| author_reputation | 266,559,244,769,431 |
| root_title | "INTRODUCTION TO CARTOGRAPHY - DATA VISUALIZATION METHODS" |
| beneficiaries | [] |
| max_accepted_payout | 1,000,000.000 HBD |
| percent_hbd | 10,000 |
| post_id | 74,539,520 |
| net_rshares | 0 |
Glad to see you back with blogging. I am suffering from the same time issues as you are ;)

I am a bit puzzled. I thought perspective geometry was much older than the 19th century, as use in paintings from the renaissance. Am I wrong?

This being said, I laughed on this one:

> The Earth is NOT FLAT by the way.
| author | lemouth |
|---|---|
| permlink | 91hlo8l7h |
| category | steemstem |
| json_metadata | {"tags":"steemstem","app":"steemstem"} |
| created | 2018-11-04 19:17:33 |
| last_update | 2018-11-04 19:17:33 |
| depth | 1 |
| children | 3 |
| last_payout | 2018-11-11 19:17:33 |
| cashout_time | 1969-12-31 23:59:59 |
| total_payout_value | 0.017 HBD |
| curator_payout_value | 0.005 HBD |
| pending_payout_value | 0.000 HBD |
| promoted | 0.000 HBD |
| body_length | 312 |
| author_reputation | 338,011,164,701,274 |
| root_title | "INTRODUCTION TO CARTOGRAPHY - DATA VISUALIZATION METHODS" |
| beneficiaries | [] |
| max_accepted_payout | 1,000,000.000 HBD |
| percent_hbd | 10,000 |
| post_id | 74,677,550 |
| net_rshares | 20,560,110,200 |
| author_curate_reward | "" |
| voter | weight | wgt% | rshares | pct | time |
|---|---|---|---|---|---|
| lordneroo | 0 | 20,560,110,200 | 100% |
Hey @lemouth, thanks for stopping by!

> I thought perspective geometry was much older than the 19th century, as use in paintings from the renaissance.

You are right, however Cartographers started experimenting with perspective geometry during the 19th century in an attempt to develop efficient methods of depicting the natural terrestrial surface's actual shape with precision.

Hehe, I still can't believe how some people think the Earth is actually flat. It's scary!

Have a great day!
| author | lordneroo |
|---|---|
| permlink | re-lemouth-91hlo8l7h-20181106t204024288z |
| category | steemstem |
| json_metadata | {"tags":["steemstem"],"users":["lemouth"],"app":"steemit/0.1"} |
| created | 2018-11-06 20:40:24 |
| last_update | 2018-11-06 20:40:24 |
| depth | 2 |
| children | 2 |
| last_payout | 2018-11-13 20:40:24 |
| cashout_time | 1969-12-31 23:59:59 |
| total_payout_value | 0.000 HBD |
| curator_payout_value | 0.000 HBD |
| pending_payout_value | 0.000 HBD |
| promoted | 0.000 HBD |
| body_length | 491 |
| author_reputation | 266,559,244,769,431 |
| root_title | "INTRODUCTION TO CARTOGRAPHY - DATA VISUALIZATION METHODS" |
| beneficiaries | [] |
| max_accepted_payout | 1,000,000.000 HBD |
| percent_hbd | 10,000 |
| post_id | 74,810,185 |
| net_rshares | 0 |
Ah ok. So they started to use it much later compared to art. That is an interesting fact :)

Have a great day too on this rounded planet (yeah I know, millions of hits on google!)
| author | lemouth |
|---|---|
| permlink | re-lordneroo-re-lemouth-91hlo8l7h-20181108t160002427z |
| category | steemstem |
| json_metadata | {"tags":["steemstem"],"app":"steemit/0.1"} |
| created | 2018-11-08 16:00:03 |
| last_update | 2018-11-08 16:00:03 |
| depth | 3 |
| children | 1 |
| last_payout | 2018-11-15 16:00:03 |
| cashout_time | 1969-12-31 23:59:59 |
| total_payout_value | 0.020 HBD |
| curator_payout_value | 0.006 HBD |
| pending_payout_value | 0.000 HBD |
| promoted | 0.000 HBD |
| body_length | 179 |
| author_reputation | 338,011,164,701,274 |
| root_title | "INTRODUCTION TO CARTOGRAPHY - DATA VISUALIZATION METHODS" |
| beneficiaries | [] |
| max_accepted_payout | 1,000,000.000 HBD |
| percent_hbd | 10,000 |
| post_id | 74,924,446 |
| net_rshares | 25,455,847,223 |
| author_curate_reward | "" |
| voter | weight | wgt% | rshares | pct | time |
|---|---|---|---|---|---|
| lordneroo | 0 | 25,455,847,223 | 100% |
Congratulations @lordneroo! You have completed the following achievement on the Steem blockchain and have been rewarded with new badge(s) :

<table><tr><td>https://steemitimages.com/60x70/http://steemitboard.com/@lordneroo/commented.png?201811031659</td><td>You got more than 1750 replies. Your next target is to reach 2000 replies.</td></tr>
</table>

<sub>_[Click here to view your Board of Honor](https://steemitboard.com/@lordneroo)_</sub>
<sub>_If you no longer want to receive notifications, reply to this comment with the word_ `STOP`</sub>


**Do not miss the last post from @steemitboard:**
<table><tr><td><a href="https://steemit.com/steemfest/@steemitboard/the-new-steemfest-award-is-ready"><img src="https://steemitimages.com/64x128/https://cdn.steemitimages.com/DQmeEYkuDHNp3c9dC6Q5s8Wysi8DrXR89FHAFiu5XoQW8Vr/SteemitBoard_header_Krakow2018.png"></a></td><td><a href="https://steemit.com/steemfest/@steemitboard/the-new-steemfest-award-is-ready">The new Steemfest³ Award is ready!</a></td></tr><tr><td><a href="https://steemit.com/steemfest/@steemitboard/i06trehc"><img src="https://steemitimages.com/64x128/https://ipfs.io/ipfs/QmU34ZrY632FFKQ1vbrkSM27VcnsjQdtXPynfMrpxDFJcF"></a></td><td><a href="https://steemit.com/steemfest/@steemitboard/i06trehc">Be ready for the next contest!</a></td></tr></table>

> Support [SteemitBoard's project](https://steemit.com/@steemitboard)! **[Vote for its witness](https://v2.steemconnect.com/sign/account-witness-vote?witness=steemitboard&approve=1)** and **get one more award**!
| author | steemitboard |
|---|---|
| permlink | steemitboard-notify-lordneroo-20181103t181502000z |
| category | steemstem |
| json_metadata | {"image":["https://steemitboard.com/img/notify.png"]} |
| created | 2018-11-03 18:15:03 |
| last_update | 2018-11-03 18:15:03 |
| depth | 1 |
| children | 0 |
| last_payout | 2018-11-10 18:15:03 |
| cashout_time | 1969-12-31 23:59:59 |
| total_payout_value | 0.000 HBD |
| curator_payout_value | 0.000 HBD |
| pending_payout_value | 0.000 HBD |
| promoted | 0.000 HBD |
| body_length | 1,532 |
| author_reputation | 38,975,615,169,260 |
| root_title | "INTRODUCTION TO CARTOGRAPHY - DATA VISUALIZATION METHODS" |
| beneficiaries | [] |
| max_accepted_payout | 1,000,000.000 HBD |
| percent_hbd | 10,000 |
| post_id | 74,617,526 |
| net_rshares | 0 |
<div class='text-justify'> <div class='pull-left'> <br /> <center> <img width='125' src='https://i.postimg.cc/9FwhnG3w/steemstem_curie.png'> </center>  <br/> </div> <br /> <br />

 This post has been voted on by the **SteemSTEM** curation team and voting trail in collaboration with **@curie**. <br />
 If you appreciate the work we are doing then consider [voting](https://www.steemit.com/~witnesses) both projects for witness by selecting [**stem.witness**](https://steemconnect.com/sign/account_witness_vote?approve=1&witness=stem.witness) and [**curie**](https://steemconnect.com/sign/account_witness_vote?approve=1&witness=curie)! <br />
For additional information please join us on the [**SteemSTEM discord**]( https://discord.gg/BPARaqn) and to get to know the rest of the community! </div>
| author | steemstem |
|---|---|
| permlink | re-lordneroo-introduction-to-cartography-data-visualization-methods-part-i-20181104t152851066z |
| category | steemstem |
| json_metadata | {"app":"bloguable-bot"} |
| created | 2018-11-04 15:28:54 |
| last_update | 2018-11-04 15:28:54 |
| depth | 1 |
| children | 0 |
| last_payout | 2018-11-11 15:28:54 |
| cashout_time | 1969-12-31 23:59:59 |
| total_payout_value | 0.534 HBD |
| curator_payout_value | 0.177 HBD |
| pending_payout_value | 0.000 HBD |
| promoted | 0.000 HBD |
| body_length | 800 |
| author_reputation | 262,017,435,115,313 |
| root_title | "INTRODUCTION TO CARTOGRAPHY - DATA VISUALIZATION METHODS" |
| beneficiaries | [] |
| max_accepted_payout | 1,000,000.000 HBD |
| percent_hbd | 10,000 |
| post_id | 74,666,236 |
| net_rshares | 626,555,750,006 |
| author_curate_reward | "" |
| voter | weight | wgt% | rshares | pct | time |
|---|---|---|---|---|---|
| lafona-miner | 0 | 0 | 15% | ||
| steemstem | 0 | 626,555,750,006 | 15% |
**Congratulations!** Your post has been selected as a daily Steemit truffle! It is listed on **rank 3** of all contributions awarded today. You can find the [TOP DAILY TRUFFLE PICKS HERE.](https://steemit.com/@trufflepig/daily-truffle-picks-2018-11-02)
I upvoted your contribution because to my mind your post is at least **13 SBD** worth and should receive **157 votes**. It's now up to the lovely Steemit community to make this come true.
I am `TrufflePig`, an Artificial Intelligence Bot that helps minnows and content curators using Machine Learning. If you are curious how I select content, [you can find an explanation here!](https://steemit.com/steemit/@trufflepig/weekly-truffle-updates-2018-43)
Have a nice day and sincerely yours,

*`TrufflePig`*
| author | trufflepig |
|---|---|
| permlink | re-introduction-to-cartography-data-visualization-methods-part-i-20181102t163241 |
| category | steemstem |
| json_metadata | "" |
| created | 2018-11-02 16:32:45 |
| last_update | 2018-11-02 16:32:45 |
| depth | 1 |
| children | 1 |
| last_payout | 2018-11-09 16:32:45 |
| cashout_time | 1969-12-31 23:59:59 |
| total_payout_value | 0.000 HBD |
| curator_payout_value | 0.000 HBD |
| pending_payout_value | 0.000 HBD |
| promoted | 0.000 HBD |
| body_length | 884 |
| author_reputation | 21,266,577,867,113 |
| root_title | "INTRODUCTION TO CARTOGRAPHY - DATA VISUALIZATION METHODS" |
| beneficiaries | [] |
| max_accepted_payout | 1,000,000.000 HBD |
| percent_hbd | 10,000 |
| post_id | 74,552,746 |
| net_rshares | 508,983,705 |
| author_curate_reward | "" |
| voter | weight | wgt% | rshares | pct | time |
|---|---|---|---|---|---|
| motherboy | 0 | 508,983,705 | 5.47% |
A big thank you to the greatest bot on the Steem blockchain!
| author | lordneroo |
|---|---|
| permlink | re-trufflepig-re-introduction-to-cartography-data-visualization-methods-part-i-20181102t163241-20181102t163420450z |
| category | steemstem |
| json_metadata | {"tags":["steemstem"],"app":"steemit/0.1"} |
| created | 2018-11-02 16:34:21 |
| last_update | 2018-11-02 16:34:21 |
| depth | 2 |
| children | 0 |
| last_payout | 2018-11-09 16:34:21 |
| cashout_time | 1969-12-31 23:59:59 |
| total_payout_value | 0.000 HBD |
| curator_payout_value | 0.000 HBD |
| pending_payout_value | 0.000 HBD |
| promoted | 0.000 HBD |
| body_length | 60 |
| author_reputation | 266,559,244,769,431 |
| root_title | "INTRODUCTION TO CARTOGRAPHY - DATA VISUALIZATION METHODS" |
| beneficiaries | [] |
| max_accepted_payout | 1,000,000.000 HBD |
| percent_hbd | 10,000 |
| post_id | 74,552,826 |
| net_rshares | 0 |