We just closed out the week week with a green 5 candle at $3.23 and a weekly high of $4.32 which was rejected by the bears.
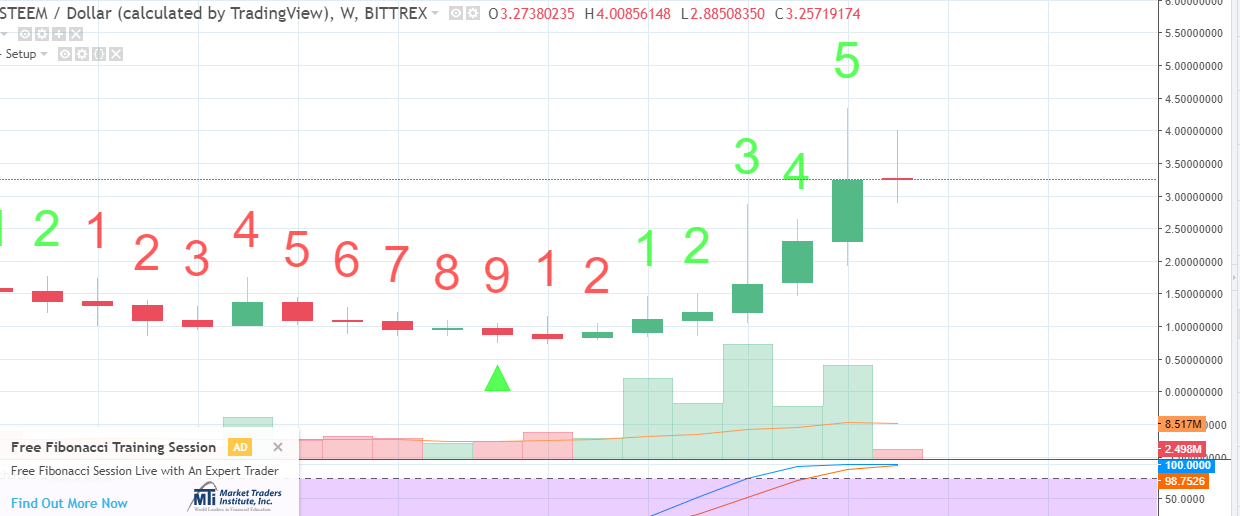
The weekly chart looks great with 6 previous green candles and closing out the week with a green 5.
Weekly: BULLISH
The daily chart looks interesting as seen below...
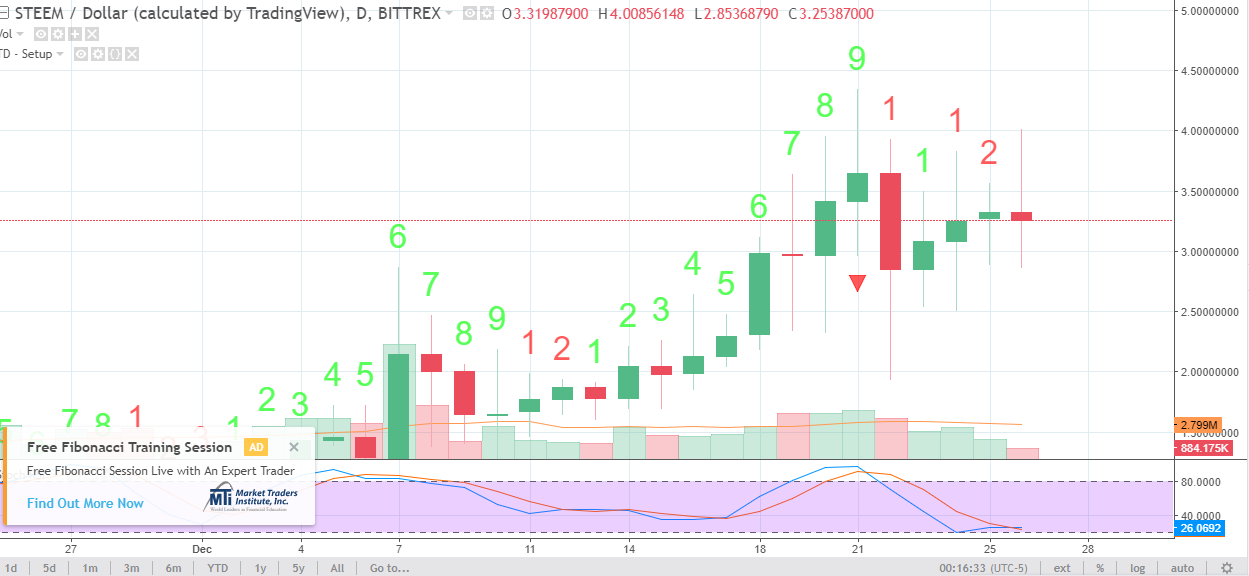
The daily is still bullish even though we are starting the day off with a red reversal candle.
Daily: BULLISH
Now let's look at the hourly chart.
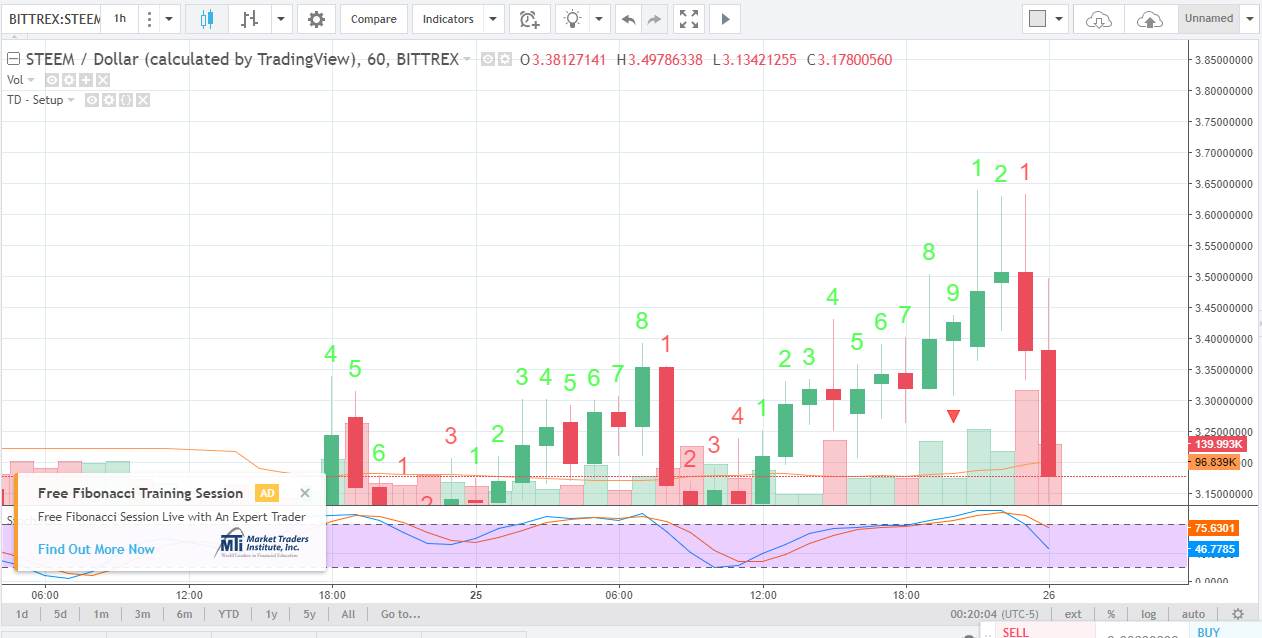
As you can see, we are dropping like a rock on the hourly chart with a red 1 candle in the previous hour. The new hourly candle is also the start of the new week.
Now the 20 hour candle closed with a red 9 and a red arrow which shows to sell and take your profits, so if you sold a few hours ago, you made a good move and you can buy back in when the hourly reverses. We haven't had a 9 red arrow hourly candle since December 18 but it quickly reversed two hours later and a small correction five hours later.
On the hourly chart, I'm bearish but this can reverse in the next hour. Yesterday we had a red 1 and 2 candle in a down trend that reversed with a green 3 candle the hour after. So let's see if we can close out this hour with a green candle.