<center></center> Supply and demand drives all price, from local flea markets to the stock market. When a lot of people want to buy a certain item with limited quantity, price will go up. On the other hand, if no one wants to buy a certain item, the seller has to lower the price until the buyer becomes interested. I’m a supply and demand trader. The premise of supply and demand trading is when the market makes a sharp move up or down the large institutions i.e banks/hedge funds are not able to get their entire trade placed into the market, leaving pending orders to buy or sell at the zone with the expectation the market will return to the zone and the rest of their trading position will be filled. However, I’m not ignorant to how other traders view the Markets. At a minimum, I have an idea of where other traders may have their market/limit orders or stop loss orders. So although people may not understand how I view the Markets, at times, I try to incorporate language that might be universal. In recent posts, I have been talking about the FANG stocks and why it will be important to monitor them for hints on where the Markets are heading. <center>[Stock Market Analysis 4-10-18...Follow The Leader....The FANG Stocks (Update)](https://steemit.com/money/@rollandthomas/stock-market-analysis-4-10-18-follow-the-leader-the-fang-stocks-update) </center> <center>[ Stock Market Analysis 4-5-18...Follow The Leader....The FANG Stocks]( https://steemit.com/stock/@rollandthomas/stock-market-analysis-4-5-18-follow-the-leader-the-fang-stocks)</center> **NOTE: THE FANG stocks + Microsoft made up almost 50% of the NASDAQ gains of 28% in 2017.** Well, the NASDAQ has formed a head and shoulder pattern on the daily chart. 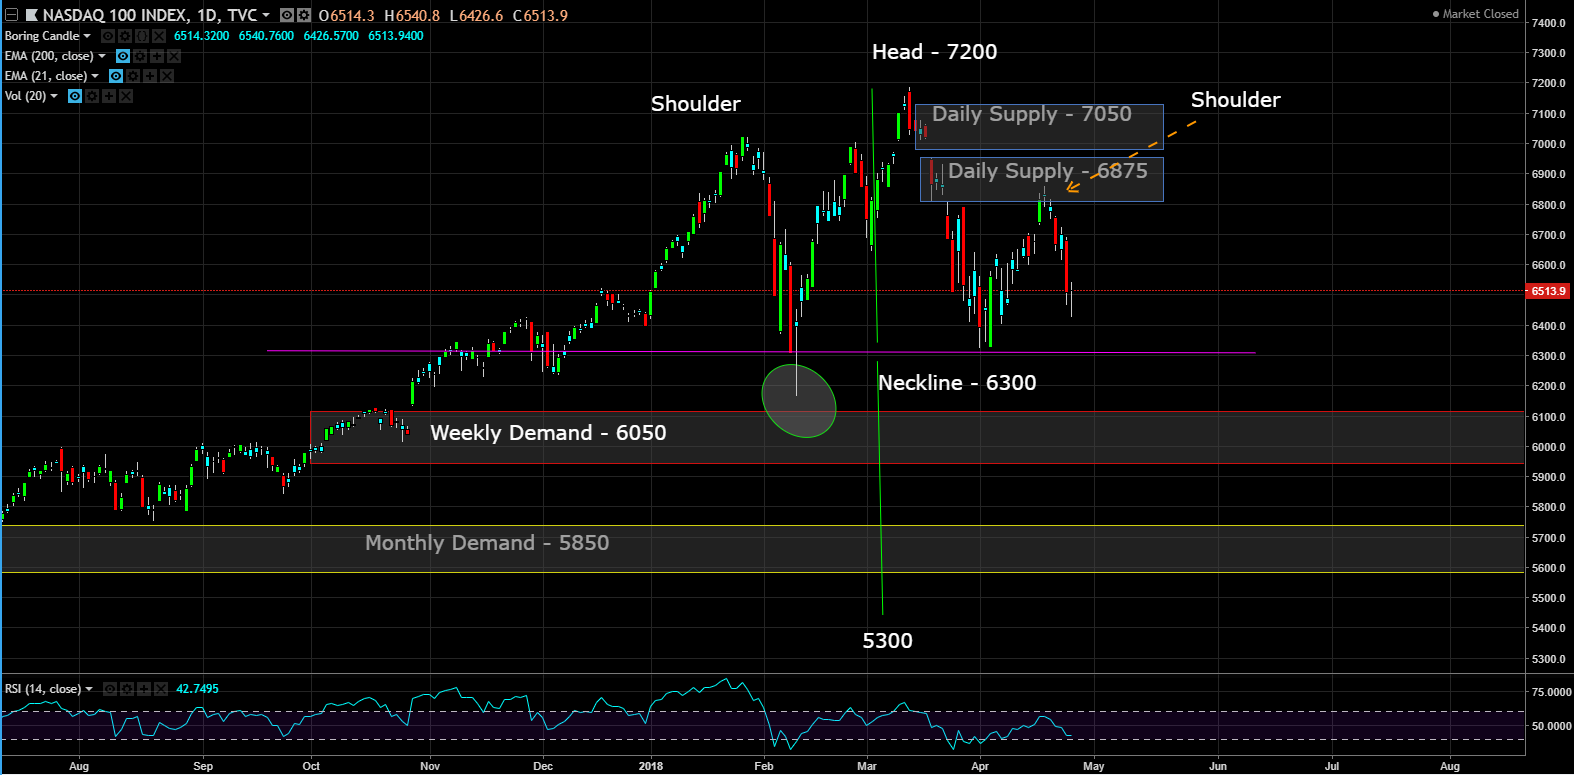 In technical analysis, a head and shoulders pattern is a chart formation that predicts a bullish-to-bearish trend reversal. It is one of several top patterns that signal, with varying degrees of accuracy, that an upward trend is nearing its end. <center>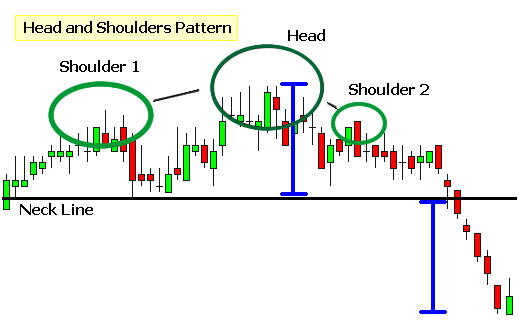</center> The initial peak and subsequent decline represent the waning momentum of the prior bullish trend. Wanting to sustain the upward movement as long as possible, bulls rally to push the price back up past the initial peak to reach a new high (the head). At this point, it is still possible that bulls could reinstate their market dominance and continue the upward trend. However, once price declines a second time and reaches a point below the initial peak, it is clear that bears are gaining ground. Bulls try one more time to push price upward, but succeed only in hitting the lesser high reached in the initial peak. This failure to surpass the highest high signals the bulls' defeat and bears take over, driving the price downward, pass the neckline and completing the reversal. <center>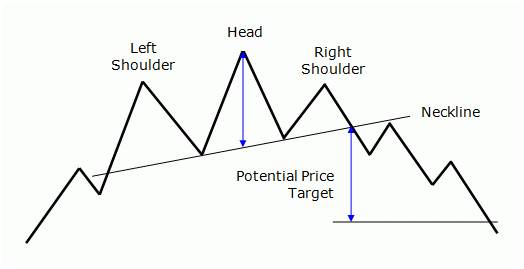</center> Usually the downward target is the same distance as the neckline to the head. In this case, that would mean price is going down to approx. 5300 on the NASDAQ 100. This level is below my Monthly Demand zone of 5850. If price makes it down to 5300 and/or the price on the monthly chart closes below the Monthly Demand level, I will be shorting the Markets on a pull back. My target is 3500 which represent a 50% decline. 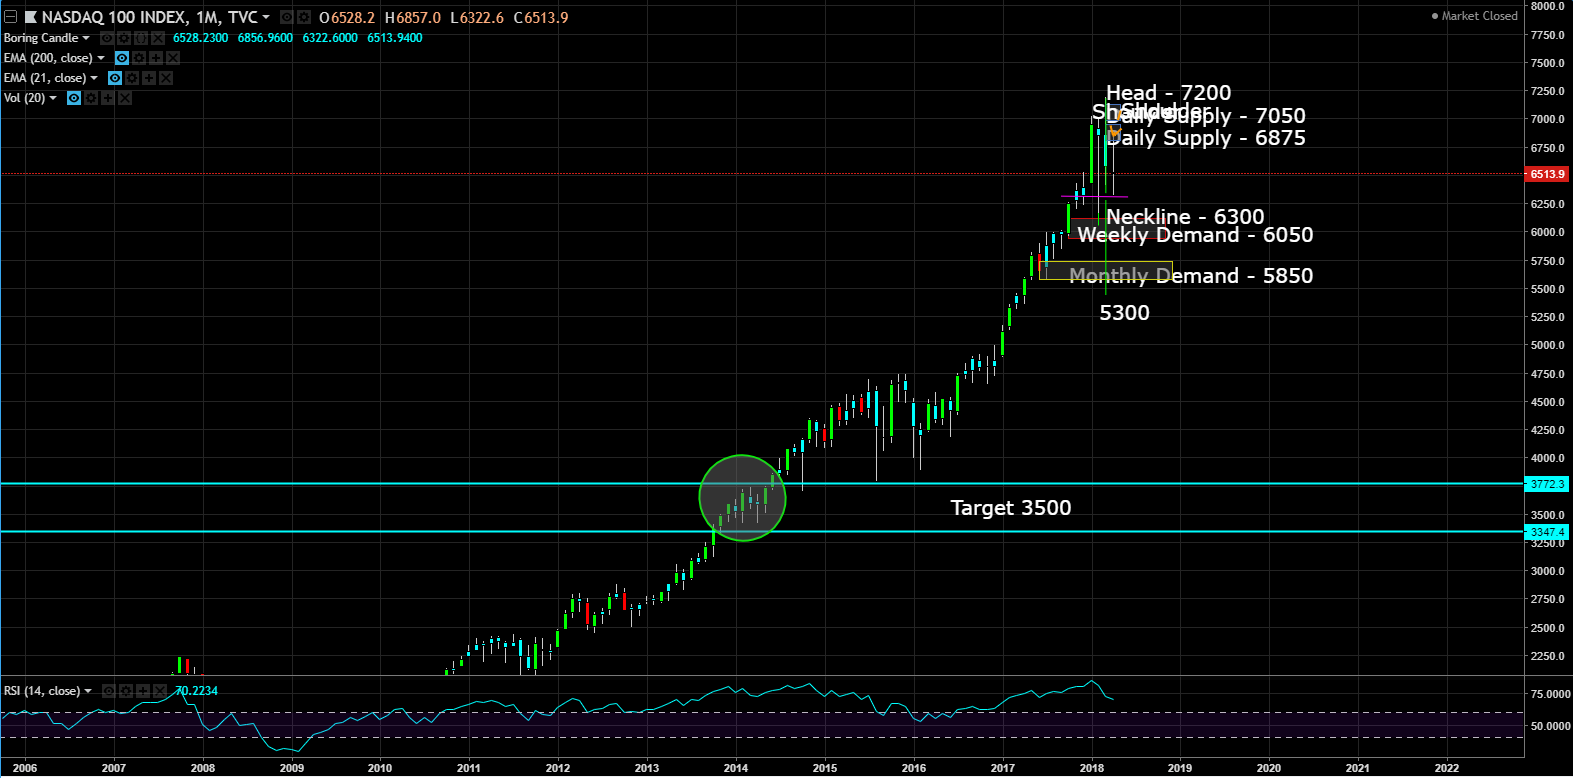 This post is my personal opinion. I’m not a financial advisor, this isn't financial advise. Do your own research before making investment decisions. 
| author | rollandthomas |
|---|---|
| permlink | stock-market-analysis-4-26-17-nasdaq-100-formed-a-head-and-shoulder-pattern |
| category | money |
| json_metadata | {"tags":["money","market","trading","investing","stock"],"image":["https://steemitimages.com/DQmdYS9kddtwL5FdPXagGGEyvphp6Tjki6kag7Z5iPUvMWZ/Avatar%20Trade2.JPG","https://steemitimages.com/DQmTvM9vt9YrWFNpLTh2uaLGrFGRMqzbNtcBZZyhzeFz1sm/image.png","https://steemitimages.com/DQmNSPqzu8FRFMZaBQguX9wUbHLs76PZNitKn6axqp2pk1A/image.png","https://steemitimages.com/DQmTV1NuSWkfYEvbzHWFMYoqQSV2cT1i8WJB5d3Rbk3gXbo/image.png","https://steemitimages.com/DQmaVg9gaDCaum8vX6eomQiUD2yyprAMEZqjyfPuUtSMpU1/image.png","https://steemitimages.com/DQmRhDtjokAZnGKi4QwheqksKTFo6m4fsjMYsNNrsitC1xk/upvote%20banner3.gif"],"links":["https://steemit.com/money/@rollandthomas/stock-market-analysis-4-10-18-follow-the-leader-the-fang-stocks-update","https://steemit.com/stock/@rollandthomas/stock-market-analysis-4-5-18-follow-the-leader-the-fang-stocks"],"app":"steemit/0.1","format":"markdown"} |
| created | 2018-04-26 12:50:54 |
| last_update | 2018-04-26 12:50:54 |
| depth | 0 |
| children | 0 |
| last_payout | 2018-05-03 12:50:54 |
| cashout_time | 1969-12-31 23:59:59 |
| total_payout_value | 4.476 HBD |
| curator_payout_value | 0.113 HBD |
| pending_payout_value | 0.000 HBD |
| promoted | 0.000 HBD |
| body_length | 3,976 |
| author_reputation | 486,267,436,549,811 |
| root_title | "Stock Market Analysis 4-26-17...NASDAQ 100 Formed A Head & Shoulder Pattern" |
| beneficiaries | [] |
| max_accepted_payout | 1,000,000.000 HBD |
| percent_hbd | 10,000 |
| post_id | 52,254,717 |
| net_rshares | 725,506,300,465 |
| author_curate_reward | "" |
| voter | weight | wgt% | rshares | pct | time |
|---|---|---|---|---|---|
| xeldal | 0 | 680,835,341,995 | 2.6% | ||
| worldclassplayer | 0 | 21,827,068,677 | 7% | ||
| filolog | 0 | 69,837,818 | 100% | ||
| barsik | 0 | 68,928,048 | 100% | ||
| gracedalton | 0 | 64,549,779 | 100% | ||
| evgenij | 0 | 74,387,213 | 100% | ||
| eupatova | 0 | 67,685,244 | 100% | ||
| asednez | 0 | 471,203,178 | 100% | ||
| kolotya | 0 | 71,275,418 | 100% | ||
| lamovamich | 0 | 70,897,087 | 100% | ||
| olgabernatzcka | 0 | 63,457,239 | 100% | ||
| chere | 0 | 486,501,983 | 100% | ||
| prata | 0 | 82,706,385 | 100% | ||
| aisterika | 0 | 504,860,548 | 100% | ||
| lachunnick | 0 | 70,796,765 | 100% | ||
| lizavaios | 0 | 90,381,772 | 100% | ||
| areabyan | 0 | 498,741,026 | 100% | ||
| enaporohni | 0 | 75,424,261 | 100% | ||
| khulin | 0 | 62,613,445 | 100% | ||
| leksazaush | 0 | 71,980,758 | 100% | ||
| artsapka1l | 0 | 69,764,226 | 100% | ||
| atjananosh | 0 | 510,980,070 | 100% | ||
| yasnanata | 0 | 504,860,548 | 100% | ||
| shestackoy | 0 | 69,940,527 | 100% | ||
| sochnik | 0 | 68,307,407 | 100% | ||
| laylunev | 0 | 72,719,190 | 100% | ||
| niktoch | 0 | 63,951,608 | 100% | ||
| prohor | 0 | 62,939,024 | 100% | ||
| olimpus | 0 | 72,888,138 | 100% | ||
| butsk | 0 | 90,576,126 | 100% | ||
| valentinafr | 0 | 67,772,982 | 100% | ||
| vtchernof | 0 | 81,970,091 | 100% | ||
| daniyarutyas | 0 | 70,492,587 | 100% | ||
| sclyuev | 0 | 70,740,357 | 100% | ||
| basyj | 0 | 90,330,299 | 100% | ||
| pashabbor | 0 | 69,179,383 | 100% | ||
| skrynnik | 0 | 72,561,521 | 100% | ||
| kleyk | 0 | 89,944,668 | 100% | ||
| bezvurg | 0 | 85,848,174 | 100% | ||
| ryushevich | 0 | 69,440,027 | 100% | ||
| opeikich | 0 | 70,528,121 | 100% | ||
| elkutuz | 0 | 88,823,805 | 100% | ||
| vitaniya | 0 | 67,868,074 | 100% | ||
| malet | 0 | 70,004,020 | 100% | ||
| traktor | 0 | 69,172,505 | 100% | ||
| zenchuk | 0 | 64,238,916 | 100% | ||
| korshunnovd | 0 | 69,795,481 | 100% | ||
| shchabacheva | 0 | 66,224,624 | 100% | ||
| karizz | 0 | 73,176,650 | 100% | ||
| kimieva | 0 | 64,803,203 | 100% | ||
| felidaman | 0 | 62,144,424 | 100% | ||
| boevnich | 0 | 477,322,700 | 100% | ||
| karold | 0 | 71,208,092 | 100% | ||
| znalex | 0 | 70,387,569 | 100% | ||
| dedemche | 0 | 217,892,227 | 100% | ||
| badzgaradze | 0 | 139,129,878 | 100% | ||
| evelinich | 0 | 188,685,459 | 100% | ||
| larakandr | 0 | 243,991,738 | 100% | ||
| motorbul | 0 | 65,662,988 | 100% | ||
| dalina | 0 | 64,659,342 | 100% | ||
| fanitl | 0 | 71,088,582 | 100% | ||
| tyutchevladim | 0 | 73,059,088 | 100% | ||
| reginaignateva5 | 0 | 80,510,869 | 100% | ||
| sta-den | 0 | 471,203,178 | 100% | ||
| svetriona | 0 | 477,322,700 | 100% | ||
| nitkaanitka | 0 | 480,382,461 | 100% | ||
| vteterin | 0 | 75,751,727 | 100% | ||
| lyubimovaleks | 0 | 471,203,178 | 100% | ||
| igor101 | 0 | 71,218,630 | 100% | ||
| lisunovaelenad | 0 | 455,904,374 | 100% | ||
| iulosat | 0 | 62,051,841 | 100% | ||
| uschakova52 | 0 | 77,623,855 | 100% | ||
| womanandgun | 0 | 492,621,504 | 100% | ||
| veslushkasvetik | 0 | 462,023,895 | 100% | ||
| zzaninimausandi | 0 | 480,382,461 | 100% | ||
| shiphulinant | 0 | 468,143,417 | 100% | ||
| voisen | 0 | 492,621,504 | 100% | ||
| taisialukina | 0 | 486,501,983 | 100% | ||
| auks | 0 | 483,442,222 | 100% | ||
| zaiggevam | 0 | 477,322,700 | 100% | ||
| memepgalv | 0 | 477,322,700 | 100% | ||
| rollandthomas | 0 | 7,436,100,151 | 100% | ||
| xmrking | 0 | 592,932,037 | 100% |