<center></center>
This tutorial is part of a series where different aspects of programming with `steem-python` are explained. Links to the other tutorials can be found in the curriculum section below. This part will explain how to perform a multi threaded block analysis of the `STEEM Blockchain` with a `MySQL` database.
---
#### Repository
https://github.com/steemit/steem-python
#### What will I learn
- Store data in parallel
- MySQL blocking
- Reduce RAM consumption
- Plotting data
#### Requirements
- Python3.6
- `steem-python`
- MySQL
- PHPMyAdmin
- Matplotlib
#### Difficulty
- intermediate
---
### Tutorial
#### Preface
The tutorial builds on the previous two tutorials: [Part 21: Use Multi Threading To Analyse The Steem Blockchain In Parallel](https://steemit.com/utopian-io/@steempytutorials/part-21-use-multi-threading-to-analyse-the-steem-blockchain-in-parallel) and [Part 26: Retrieving Data From The STEEM Blockchain And Storing Into A MySQL Database](https://steemit.com/utopian-io/@steempytutorials/part-26-retrieving-data-from-the-steem-blockchain-and-storing-into-a-mysql-database).
`STEEM` has a block time of 3 seconds, that means that every day 28 800 new blocks are created. Analysing those in `serial` will take a long time. A better way to do so would be in `parallel`. Doing so will drastically improve performance but also introduce new problems which will be discussed in this tutorial.
This tutorial will show how to analyse a large amount of `blocks` and count the amount of `transactions` occurring per minute, per hour and per day. Storing all the data in a database and plotting the data afterwards.
#### Setup
Download the files from [Github](https://github.com/amosbastian/steempy-tutorials/tree/master/part_27). There 3 are files `analysis.py` which is the main file, `database.py` which contains the interactions with the `MySQL` database and `plot.py` which is used to plot the generated data. `analysis.py` takes two arguments that set the `amount_of_blocks` and `thread_amount`. It is important that the `amount_of_blocks` is an even multiple of the `thread_amount`. `plot.py` takes one argument which sets the `date` to plot the data for.
Run scripts as following:
`> python analysis.py 65536 16`
`> python plot.py 2018-07-06`
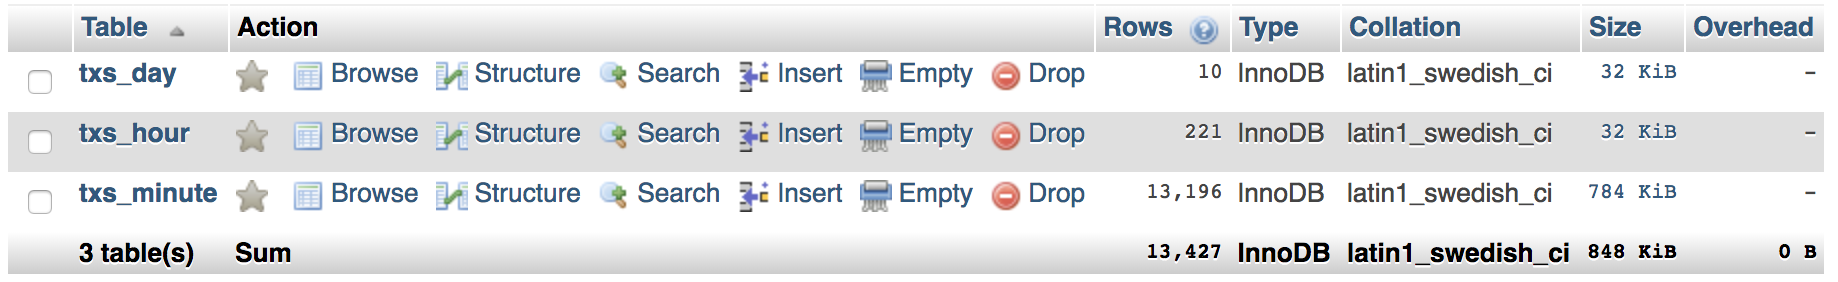
### Configure the database
The code is set up to store the data in a database `steem` with 3 different tables: `txs_minute`, `txs_hour` and `txs_day`. Also a user `test` with the password `Test!234#` is used. Executing the code below will set everything up in the same manner. If you wish to use your own settings make sure to make the appropriate changes in `database.py`.
Login as the root user:
```
mysql -u root -p
```
Create a test account, this account is used in the code:
```
GRANT ALL PRIVILEGES ON *.* TO 'test'@'localhost' IDENTIFIED BY 'Test!234#';
```
Create a new database called `steem`:
```
CREATE DATABASE steem;
```
Create the tables for storing the data:
```
CREATE TABLE `steem`.`txs_minute` ( `id` INT NOT NULL AUTO_INCREMENT , `date` DATETIME NOT NULL , `amount` INT NOT NULL , PRIMARY KEY (`id`), UNIQUE (`date`)) ENGINE = InnoDB;
CREATE TABLE `steem`.`txs_hour` ( `id` INT NOT NULL AUTO_INCREMENT , `date` DATETIME NOT NULL , `amount` INT NOT NULL , PRIMARY KEY (`id`), UNIQUE (`date`)) ENGINE = InnoDB;
CREATE TABLE `steem`.`txs_day` ( `id` INT NOT NULL AUTO_INCREMENT , `date` DATETIME NOT NULL , `amount` INT NOT NULL , PRIMARY KEY (`id`), UNIQUE (`date`)) ENGINE = InnoDB;
```
Exit mysql:
```
\q
```
<center>
</center>
#### Store data in parallel
The amount of transactions for a given `date`, `hour` and `minute` will be stored in 3 different tables. This allows for different resolutions for performing analysis after. The `timestamp` is used as the unique `key` value in a dict with a `frequency counter`. All of this information is taken from the `timestamp` that is located inside each `block` and converted to a `datetime_object`.
```
timestamp = block['timestamp']
datetime_object = datetime.strptime(timestamp, '%Y-%m-%dT%H:%M:%S')
for operation in block['transactions']:
hour = datetime_object.hour
minute = datetime_object.minute
self.process_transaction(f'{hour}:{minute}:00', self.data_minute)
self.process_transaction(f'{hour}:00:00', self.data_hour)
self.process_transaction(f'00:00:00', self.data_day)
```
<br>
The way the parallelisation works in this code is that all the `blocks` that are to be analysed are divided evenly among all of `threads`. This means that several `threads` can be working on the same unique `key`. For example the same `date`.
```
def process_transaction(self, string, data):
key = str(self.date) + ' ' + string
if string in data:
data[key] += 1
else:
data[key] = 1
```
<br>
When storing the data from memory to the database multiple `threads` may want to add the same unique `key` to the `table`. To prevent this, first a check has to be done to see if the `key` is already in the the `table`. If so the `record` must be `updated` instead of `inserted`.
```
if self.check_if_record_exist(date, table):
update_record(amount, date, table)
else:
insert_record(amount, date, table)
```
#### MySQL blocking
Now imagine two `threads` accessing the database at the same time. Thread 1 and thread 2 both check to see if the date `2018-07-06` is already in the database. Now if one of `threads` looked in the database just before the other `thread` did an `insert` or `update` it would see the old data. It would then precede to use to old data to `update` the `record`. Omitting the work of the previous `thread`. This can be prevented by `locking` the `table`.
```
cursor.execute(f"LOCK TABLES {table} WRITE;")
```
<br>
By `locking` the `table` any other `thread` is unable to perform any writing actions. By having each `thread` acquire their own `lock` first they will not be able to make any reading actions as well. Python gracefully deals with this situation by waiting until the `lock` is released.
```
cursor.execute("UNLOCK TABLES;")
```
#### Reduce RAM consumption
When performing large scale analysis on the blockchain the amount of `RAM` usage can increase significantly. Reducing `RAM` usage while also keeping performance in mind is therefor important. Depending on the type of analysis being done it is recommended to clear the data `buffers` regularly, but not to often to reduce overhead. With 28 800 blocks per day, 1 week would be 201 600 blocks and 4 weeks 806 400 blocks. At the time of writing each block contains about 50 `transactions`. The amount of operations adds up quickly, especially when storing more variables.
For this tutorial every hour of `blocks` analysed each `thread` inserts the data into the database and clears its `buffers`. Doing so also spreads out interaction with the database so that `threads` will be less likely to have to wait on each other.
```
if datetime_object.hour != self.hour:
self.dump_data()
self.data_hour = {}
self.data_minute = {}
self.data_day = {}
self.hour = datetime_object.hour
```
#### Plotting data
`pyplot` which is part of `matplotlib` is very useful tool for plotting `graphs`. In the case of plotting the data for the amount of `transactions` per hour for a given date the `query` would be as follows. `BETWEEN` allows for a specific date range to set.
```
query = (f"SELECT `date`,`amount` FROM `{table}` WHERE `date` " +
f"BETWEEN '{start_date}' AND '{end_date}' " +
"ORDER BY `date` ASC;")
```
`datetime` can be used with `timedelta` to calculate the `end_date` from a `start_date` that looks like `%Y-%m-%d` as follows:
```
start_date = datetime.strptime(date, '%Y-%m-%d').date()
end_date = start_date + timedelta(days=1)
```
The `x` and `y` values for the graph are fetched from the database and put into separate lists. `x` will be used to plot the times while `y` plot the amount of transactions.
```
x, y = db.get_data(start_date, 'txs_hour')
for result in self.cur.fetchall():
x.append(result[0])
y.append(result[1])
return x, y
```
The values are then plotted using `pyplot`. Labels are added for the `x` and `y` axis. Finally a grid is added and `tight_layout()` is called so that everything fits on the generated `grap`h.
```
plt.plot(x, y)
plt.xlabel('time in [UTC]')
plt.ylabel('transactions/hour')
plt.tight_layout()
plt.grid()
```
The `x` values are `datetime objects`. `Dates` from `matplotlib` is used to process these values. `major_locator` sets the `x` values to display on the graph, for which `hours` will be used. For formatting `%H:%M` is used to omit the `date` and the `seconds`. `xlim()` sets the `start` and `end values` for the x asis and `xtick(rotation=45)` rotates the `x labels` so they stay readable.
```
hours = mdates.HourLocator()
t_fmt = mdates.DateFormatter('%H:%M')
plt.gca().xaxis.set_major_locator(hours)
plt.gca().xaxis.set_major_formatter(t_fmt)
plt.xlim([x[0], x[len(x)-1]])
plt.xticks(rotation=45)
```
#### Running the script
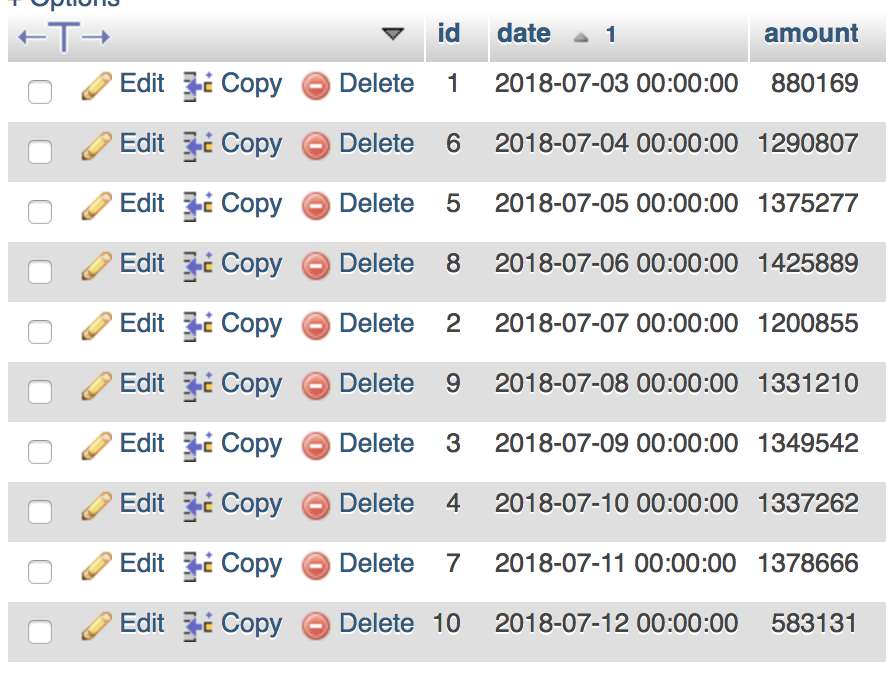
Running `analysis.py` with the arguments `number_of_blocks` and `number_of_threads` will start analysing the number of `blocks` starting from current `head_block` - `number_of_blocks`. It will then store the amount of `transactions` occurring in all of the blocks for each `minute`, `hour` and `day`. Depending on the amount of blocks being analysed this may still take a while.
`> python analysis.py 262144 16`
Took at least half an hour and resulted in the following table for days:
<center>
</center>
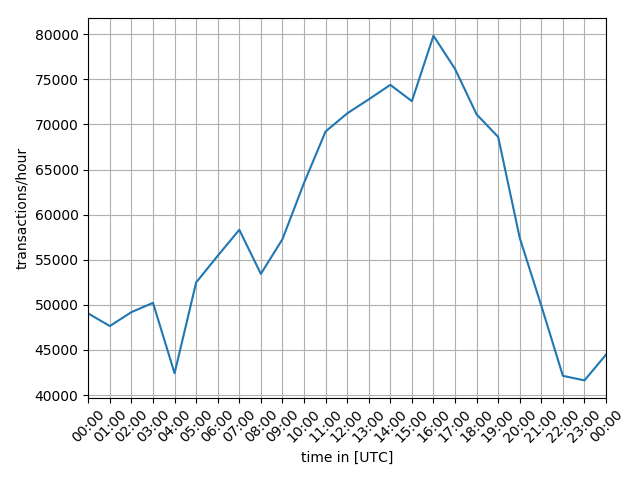
Having a closer look running `plot.py` for the date `2018-07-06` then returned the following graph:
`> python plot.py 2018-07-06`
<center>
</center>
#### Curriculum
##### Set up:
- [Part 0: How To Install Steem-python, The Official Steem Library For Python](https://steemit.com/utopian-io/@amosbastian/how-to-install-steem-python-the-official-steem-library-for-python)
- [Part 21: Use Multi Threading To Analyse The Steem Blockchain In Parallel](https://steemit.com/utopian-io/@steempytutorials/part-21-use-multi-threading-to-analyse-the-steem-blockchain-in-parallel)
- [Part 26: Retrieving Data From The STEEM Blockchain And Storing Into A MySQL Database](https://steemit.com/utopian-io/@steempytutorials/part-26-retrieving-data-from-the-steem-blockchain-and-storing-into-a-mysql-database)
---
The code for this tutorial can be found on [GitHub](https://github.com/amosbastian/steempy-tutorials/tree/master/part_27)!
This tutorial was written by @juliank.