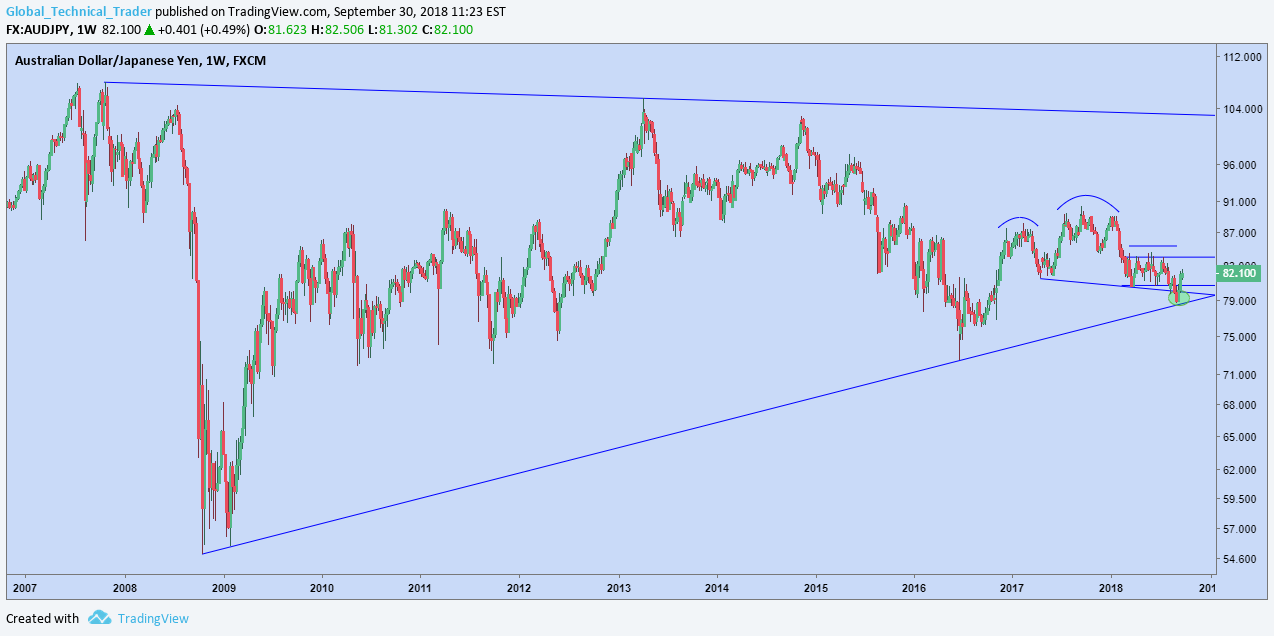
AUDJPY has the potential for a significant rally to the upside. It can be seen that the lows of 4 weeks ago found support just above the uptrend drawn from the lows in 2008 and in 2016.
Also of interest is the failed breakdown (circled in green) from the declining H&S neckline (flat right shoulder) and subsequent rally. Failed breakdowns often resolve very quickly in the opposite direction and this cross can move very fast when it gets going. It's also a risk on cross and with equity markets looking, in my opinion, for continued upside, I'm expecting to see a strong rally here.
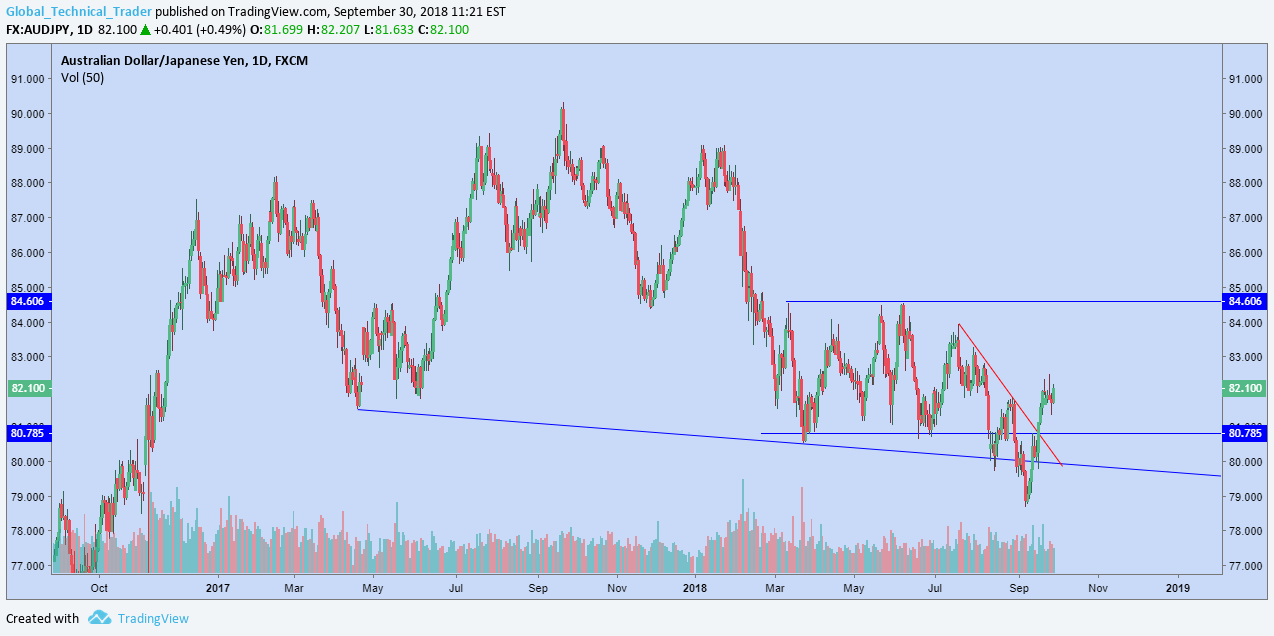
Daily chart below shows the top of the right shoulder where prices is likely to meet some selling pressure. Beyond that, next resistance is ~90 and beyond that, we have to be looking at the upper boundary of the triangle slightly above the 100 level.
USDJPY analysis here: https://steemit.com/trading/@technicaltrader/usdjpy-breakout-124-in-sight-risk-on-for-equity-markets