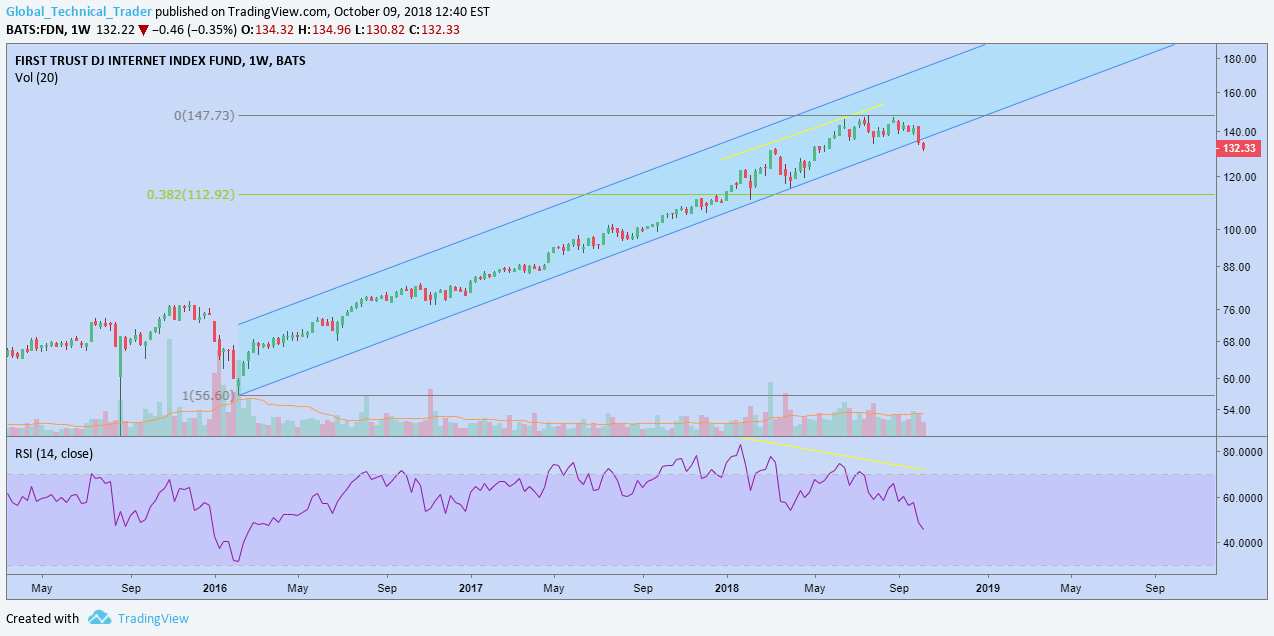
 This chart is one of a few that suggest to me that tech in the US has further to go to the downside. The main holding of this fund are the big boys such as Google, Amazon, Netflix, Salesforce, Facebook etc... The trend of FDN has clearly broken to the downside and the daily chart shows a symmetrical triangle topping pattern in place also. As with many charts right now, there is significant negative divergence on the weekly chart suggesting a higher probability that the top is one of significance. Looking at the 38.2% Fibonacci retrace level, we are looking at a target price that's around the February lows of 110.5. That's almost 15% downside from current levels.
| author | technicaltrader |
|---|---|
| permlink | internet-index-fund-fdn-price-analysis |
| category | trading |
| json_metadata | {"tags":["trading","stocks","money","investment","finance"],"image":["https://cdn.steemitimages.com/DQmS67rKj6xRJPhN2M4NLffewpaT8fukMU6m4wRpa8SDJuW/image.png"],"app":"steemit/0.1","format":"markdown"} |
| created | 2018-10-09 17:44:42 |
| last_update | 2018-10-09 17:44:42 |
| depth | 0 |
| children | 0 |
| last_payout | 2018-10-16 17:44:42 |
| cashout_time | 1969-12-31 23:59:59 |
| total_payout_value | 0.000 HBD |
| curator_payout_value | 0.000 HBD |
| pending_payout_value | 0.000 HBD |
| promoted | 0.000 HBD |
| body_length | 767 |
| author_reputation | 72,595,468,198 |
| root_title | "Internet Index Fund (FDN) Price Analysis" |
| beneficiaries | [] |
| max_accepted_payout | 1,000,000.000 HBD |
| percent_hbd | 10,000 |
| post_id | 72,955,331 |
| net_rshares | 0 |