create account

KOSPI; Bullish Inverse Head and Shoulders Pattern by technicaltrader

View this thread on: hive.blogpeakd.comecency.com
· @technicaltrader ·
KOSPI; Bullish Inverse Head and Shoulders Pattern
![](https://cdn.steemitimages.com/DQmSDzi49uiibLcNYvqyJ9ZnQ3UhaMBW5tBUGz3q3rCa2A3/image.png)

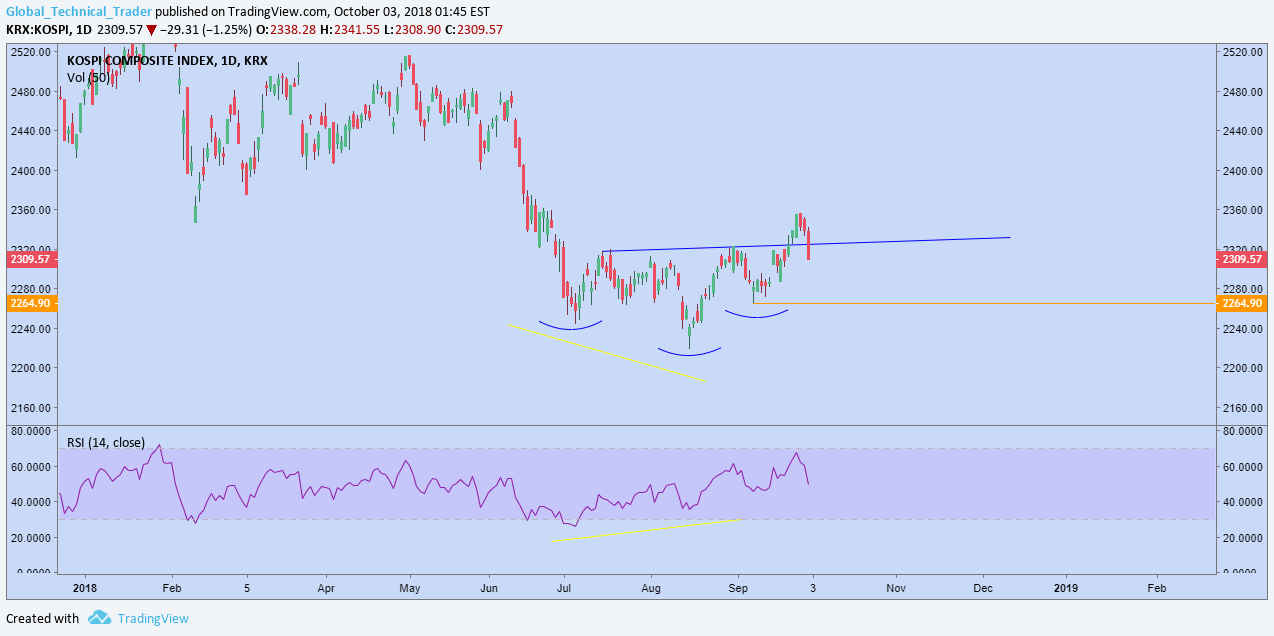
The daily chart on the KOSPI sports a lovely looking inverse head and shoulders that formed with bullish divergence to add weight to the strength of the pattern.  Taking a look at the weekly chart below shows the pattern also happened to form as price retested the 2011 high, a level that was only broken above 6 years later in May of last year. Whilst yesterday's price action moved back below the neck, the pattern is not invalidated until it moves below the right shoulder at 2,264.9. A move below that level would have significant bearish implications. However, should price move back above the neckline and make a new swing high, it would likely mark the end of the downtrend off the January high and present plenty of upcoming bullish trading opportunities.


![](https://cdn.steemitimages.com/DQmcdKuD5SgDN66nqVSzXqGRaJvCLUNDMytW6sZz5mQCZ9B/image.png)
properties (22)
authortechnicaltrader
permlinkkospi-bullish-inverse-head-and-shoulders-pattern
categorytrading
json_metadata{"tags":["trading","stocks","money","investment","finance"],"image":["https://cdn.steemitimages.com/DQmSDzi49uiibLcNYvqyJ9ZnQ3UhaMBW5tBUGz3q3rCa2A3/image.png","https://cdn.steemitimages.com/DQmcdKuD5SgDN66nqVSzXqGRaJvCLUNDMytW6sZz5mQCZ9B/image.png"],"app":"steemit/0.1","format":"markdown"}
created2018-10-03 06:53:21
last_update2018-10-03 06:53:21
depth0
children0
last_payout2018-10-10 06:53:21
cashout_time1969-12-31 23:59:59
total_payout_value0.000 HBD
curator_payout_value0.000 HBD
pending_payout_value0.000 HBD
promoted0.000 HBD
body_length952
author_reputation72,595,468,198
root_title"KOSPI; Bullish Inverse Head and Shoulders Pattern"
beneficiaries[]
max_accepted_payout1,000,000.000 HBD
percent_hbd10,000
post_id72,527,810
net_rshares0