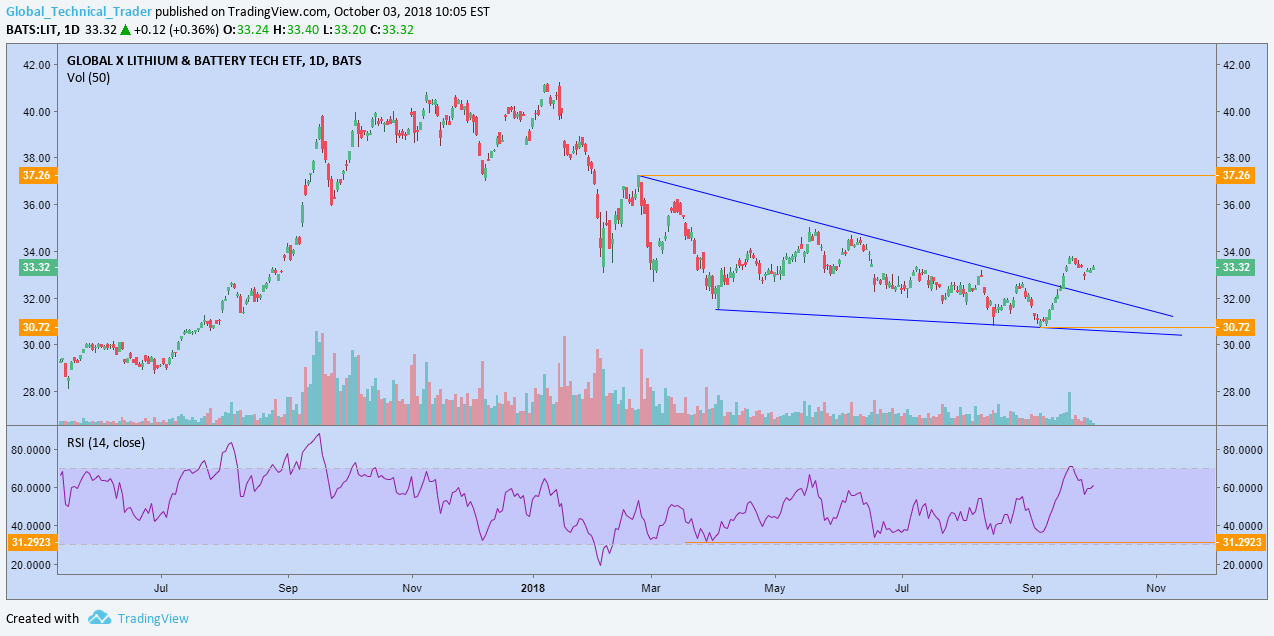
LIT looks interesting again on the long side now that the current down trend has come to an end with a breakout from the falling wedge.
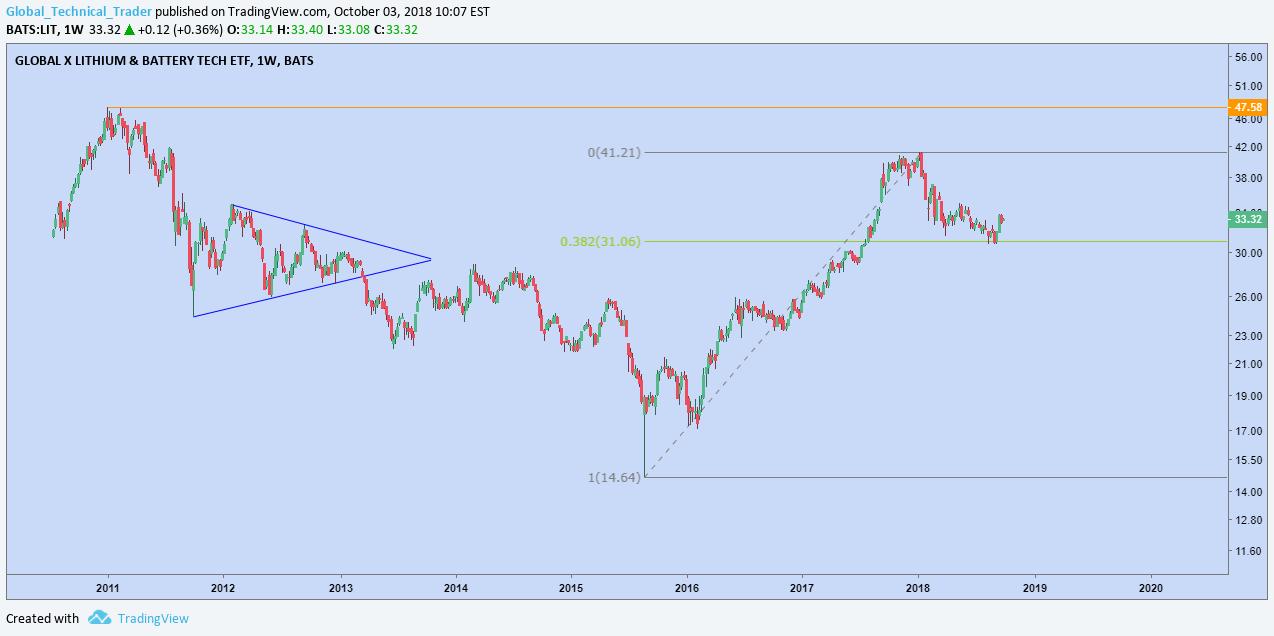
Two things make this trade/sector interesting. Firstly, the daily chart shows that post the initial sell-off low in February, RSI has failed to move below 30 suggesting that there was little momentum or strength to the sell off. Also, the weekly chart below shows the January to September decline only reaching the 38.2% retrace of the August '15 - Jan '18 rally. Shallow retraces are indicative of underlying strength and given this was a sector showing strong relative strength off those 2015 lows, it looks like that strength is about to resume.
Short-term target is the beginning of the wedge formation at 36.26 before targeting the Jan highs and all time highs thereafter. A move below the September low of 30.72 would negate the bullish outlook.