
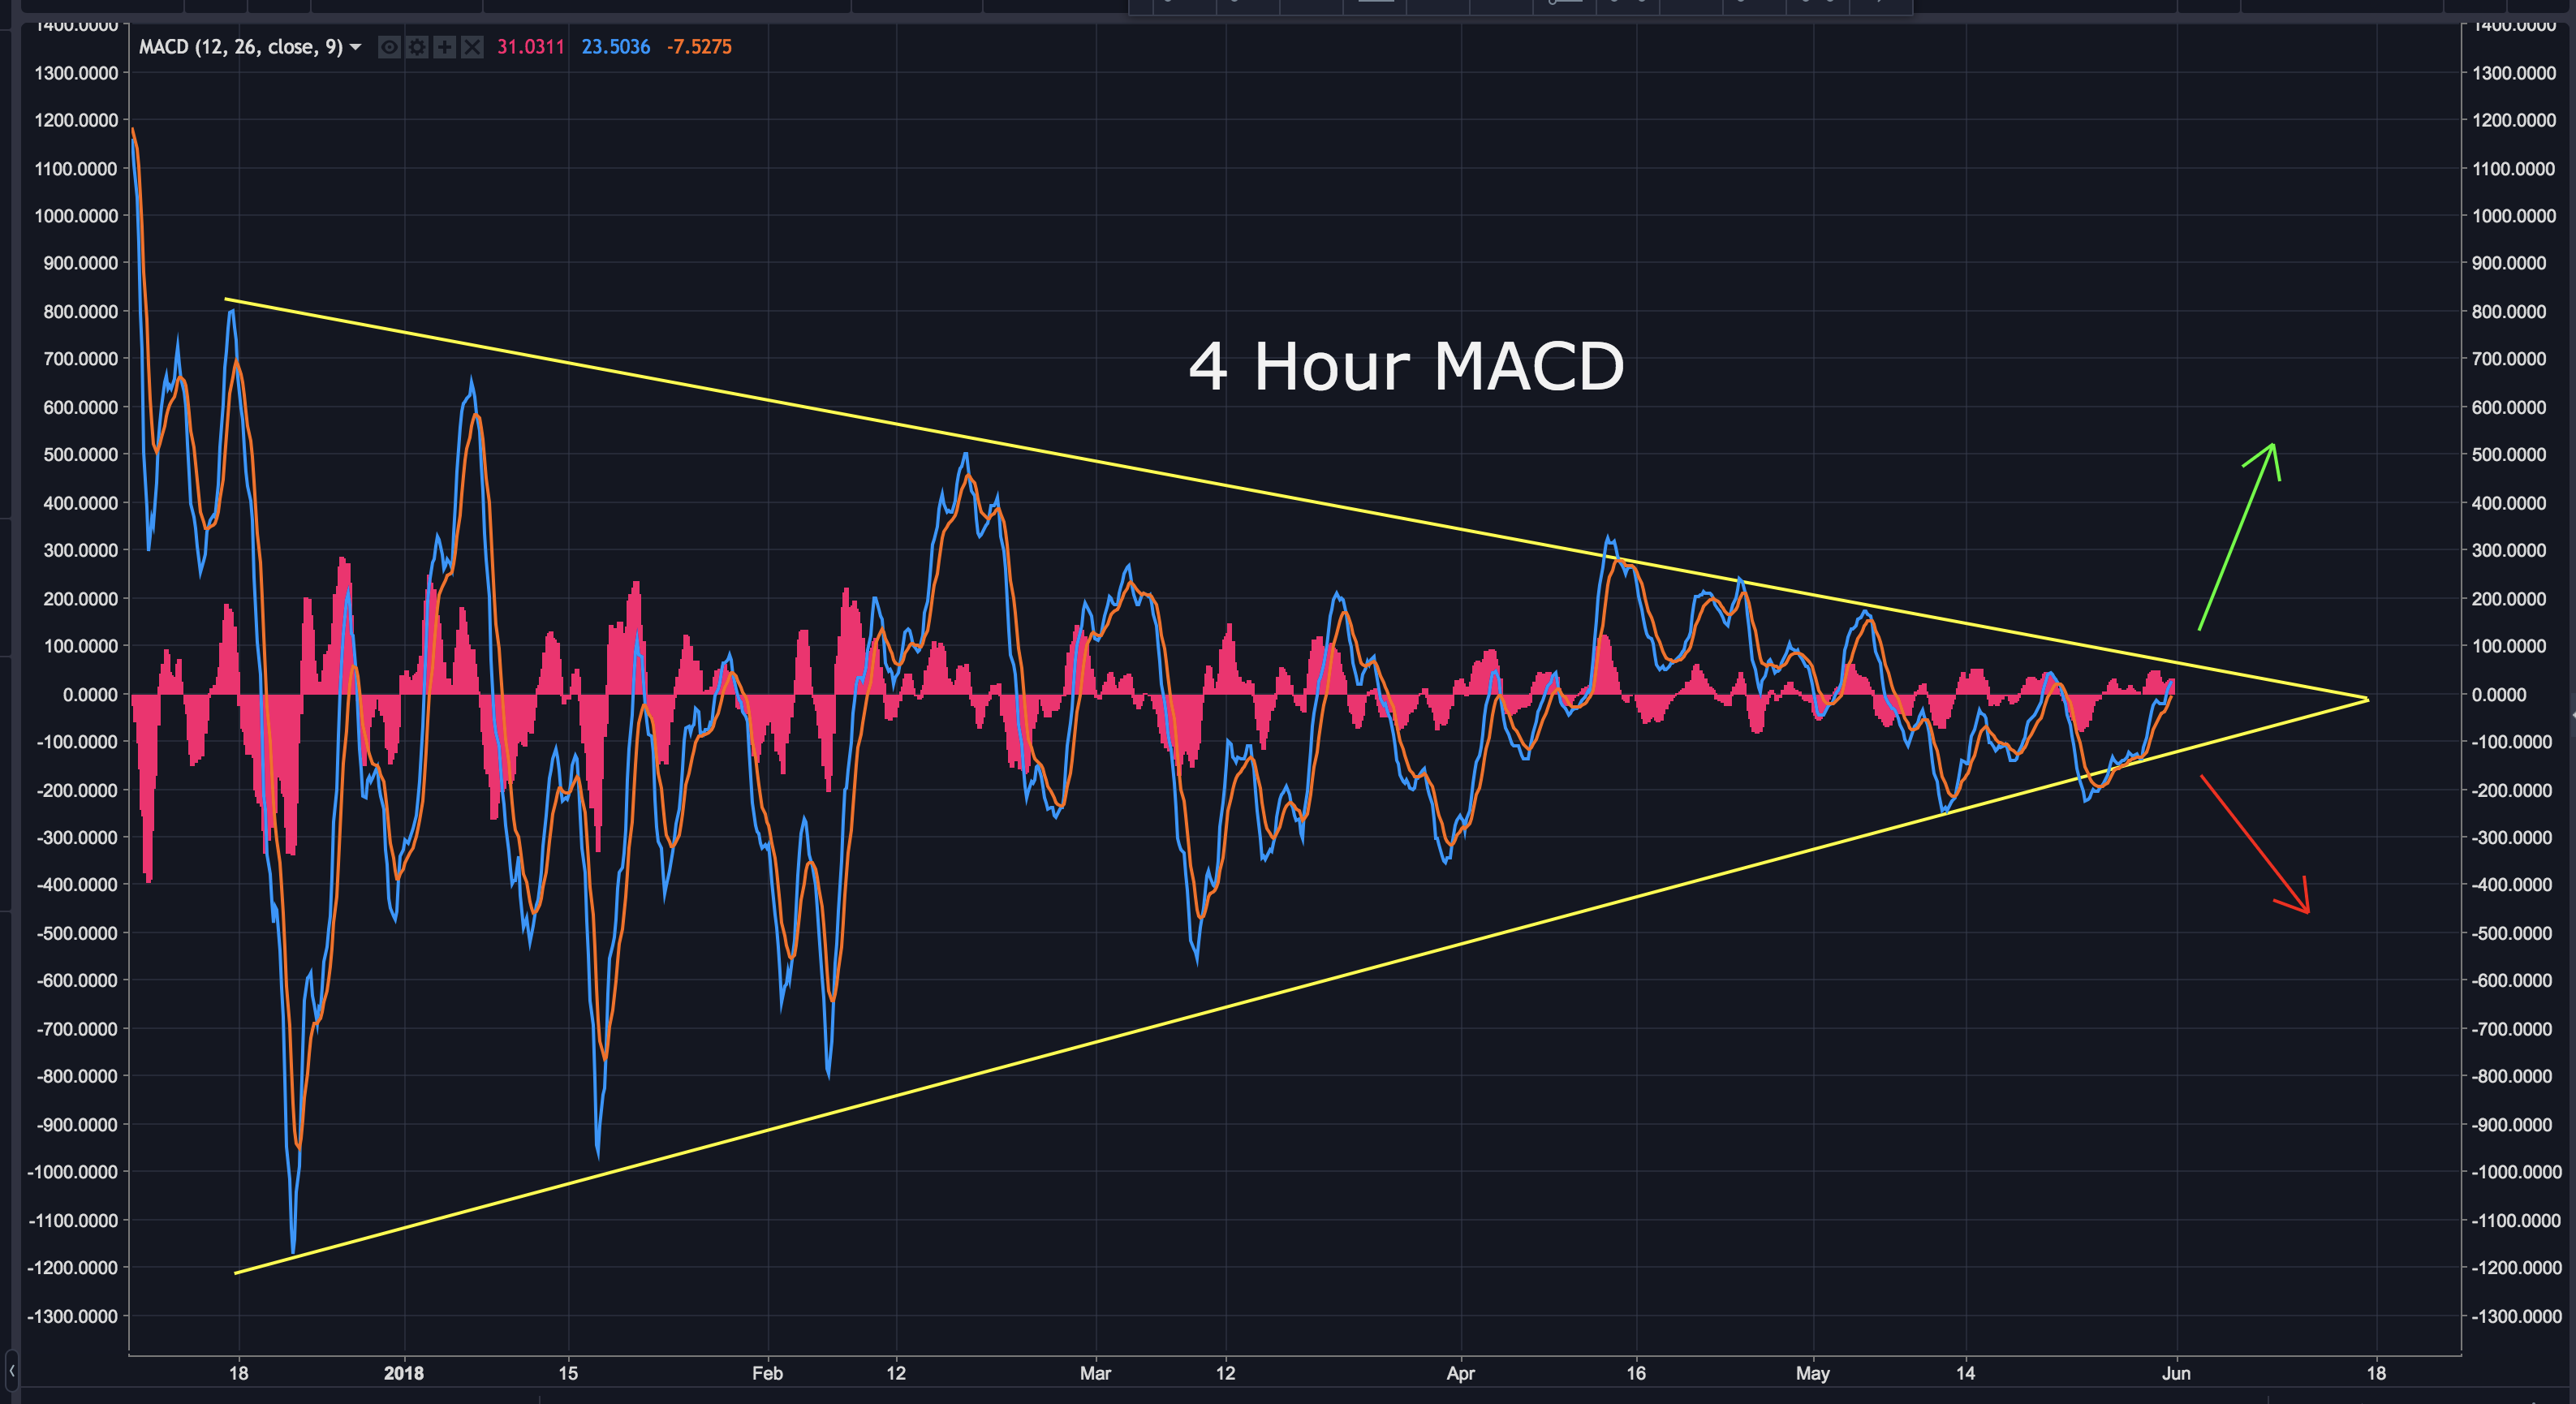
Bitcoin's been consolidating since my last update. We may be watching the calm before the storm...in a good way...I hope. I've been pointing out for weeks the 4 hour MACD that's been tightening within a wedge. As bitcoin moves closer to the apex, a breakout becomes likely.
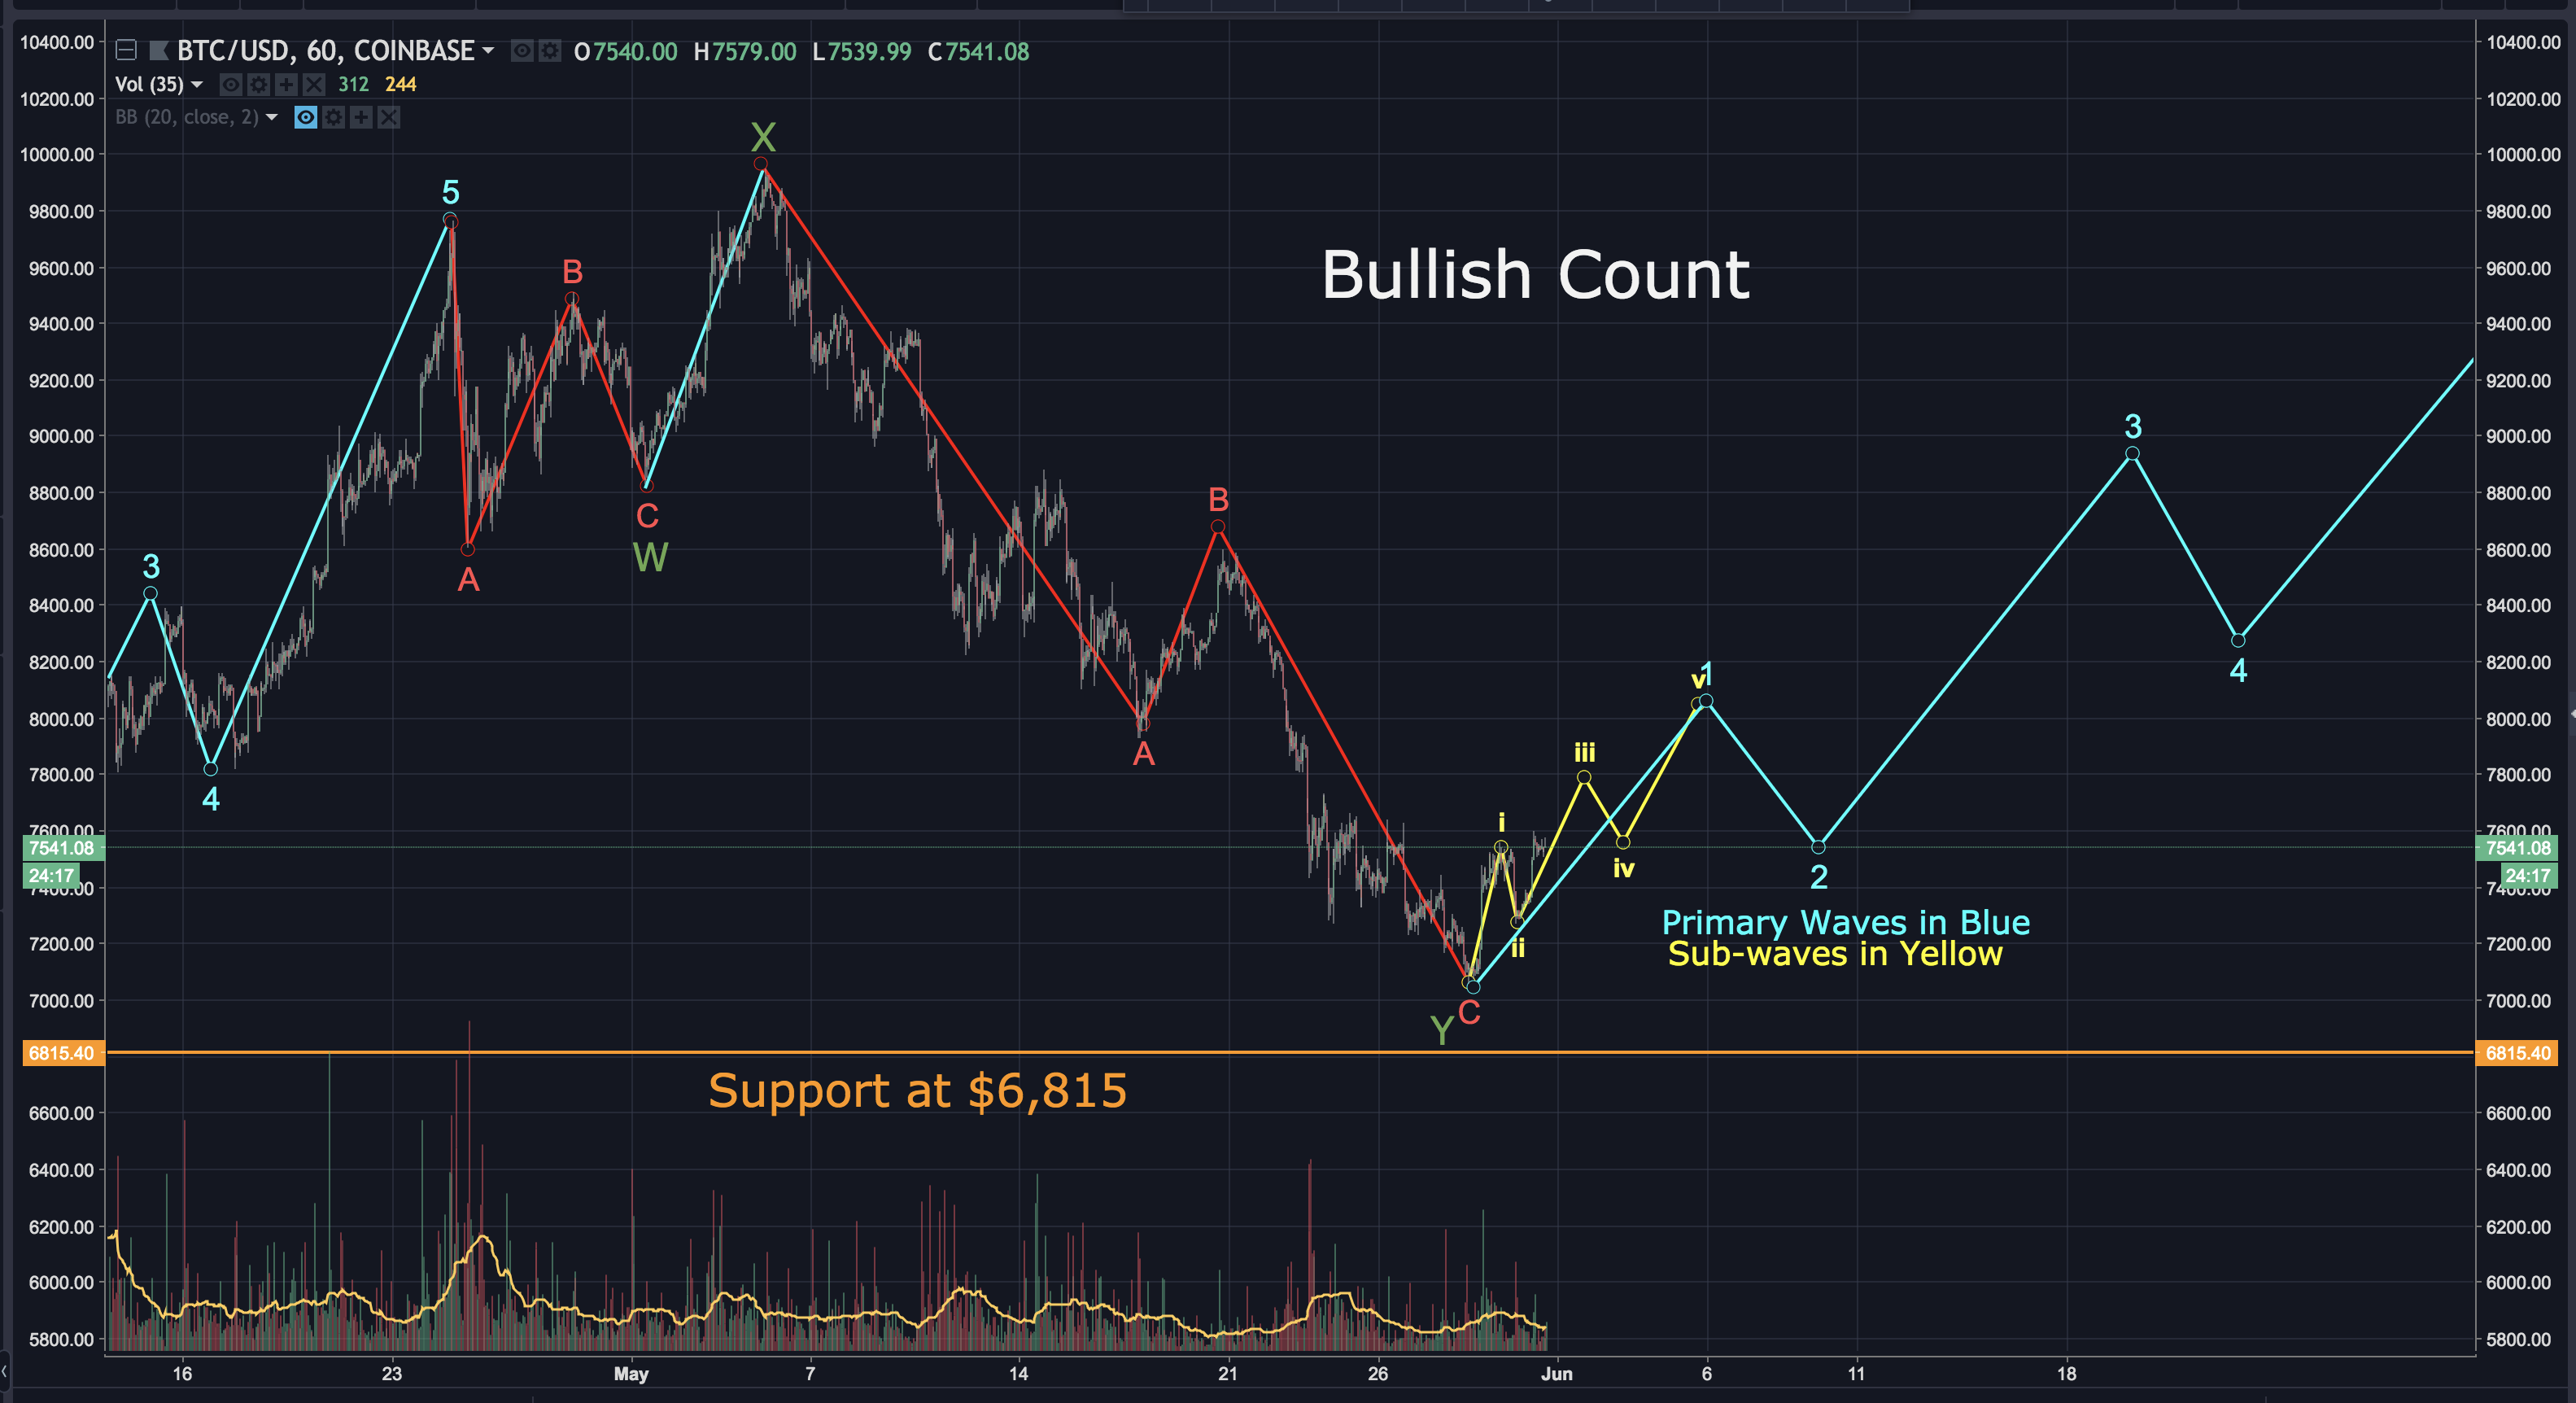
The 2 scenarios outlined in my prior update are still very much in play. Let's start with the bullish count....
If my bullish count is accurate, bitcoin completed a WXY pattern. It's now on wave 1 of 5 waves up. I've highlighted the sub-waves in yellow.
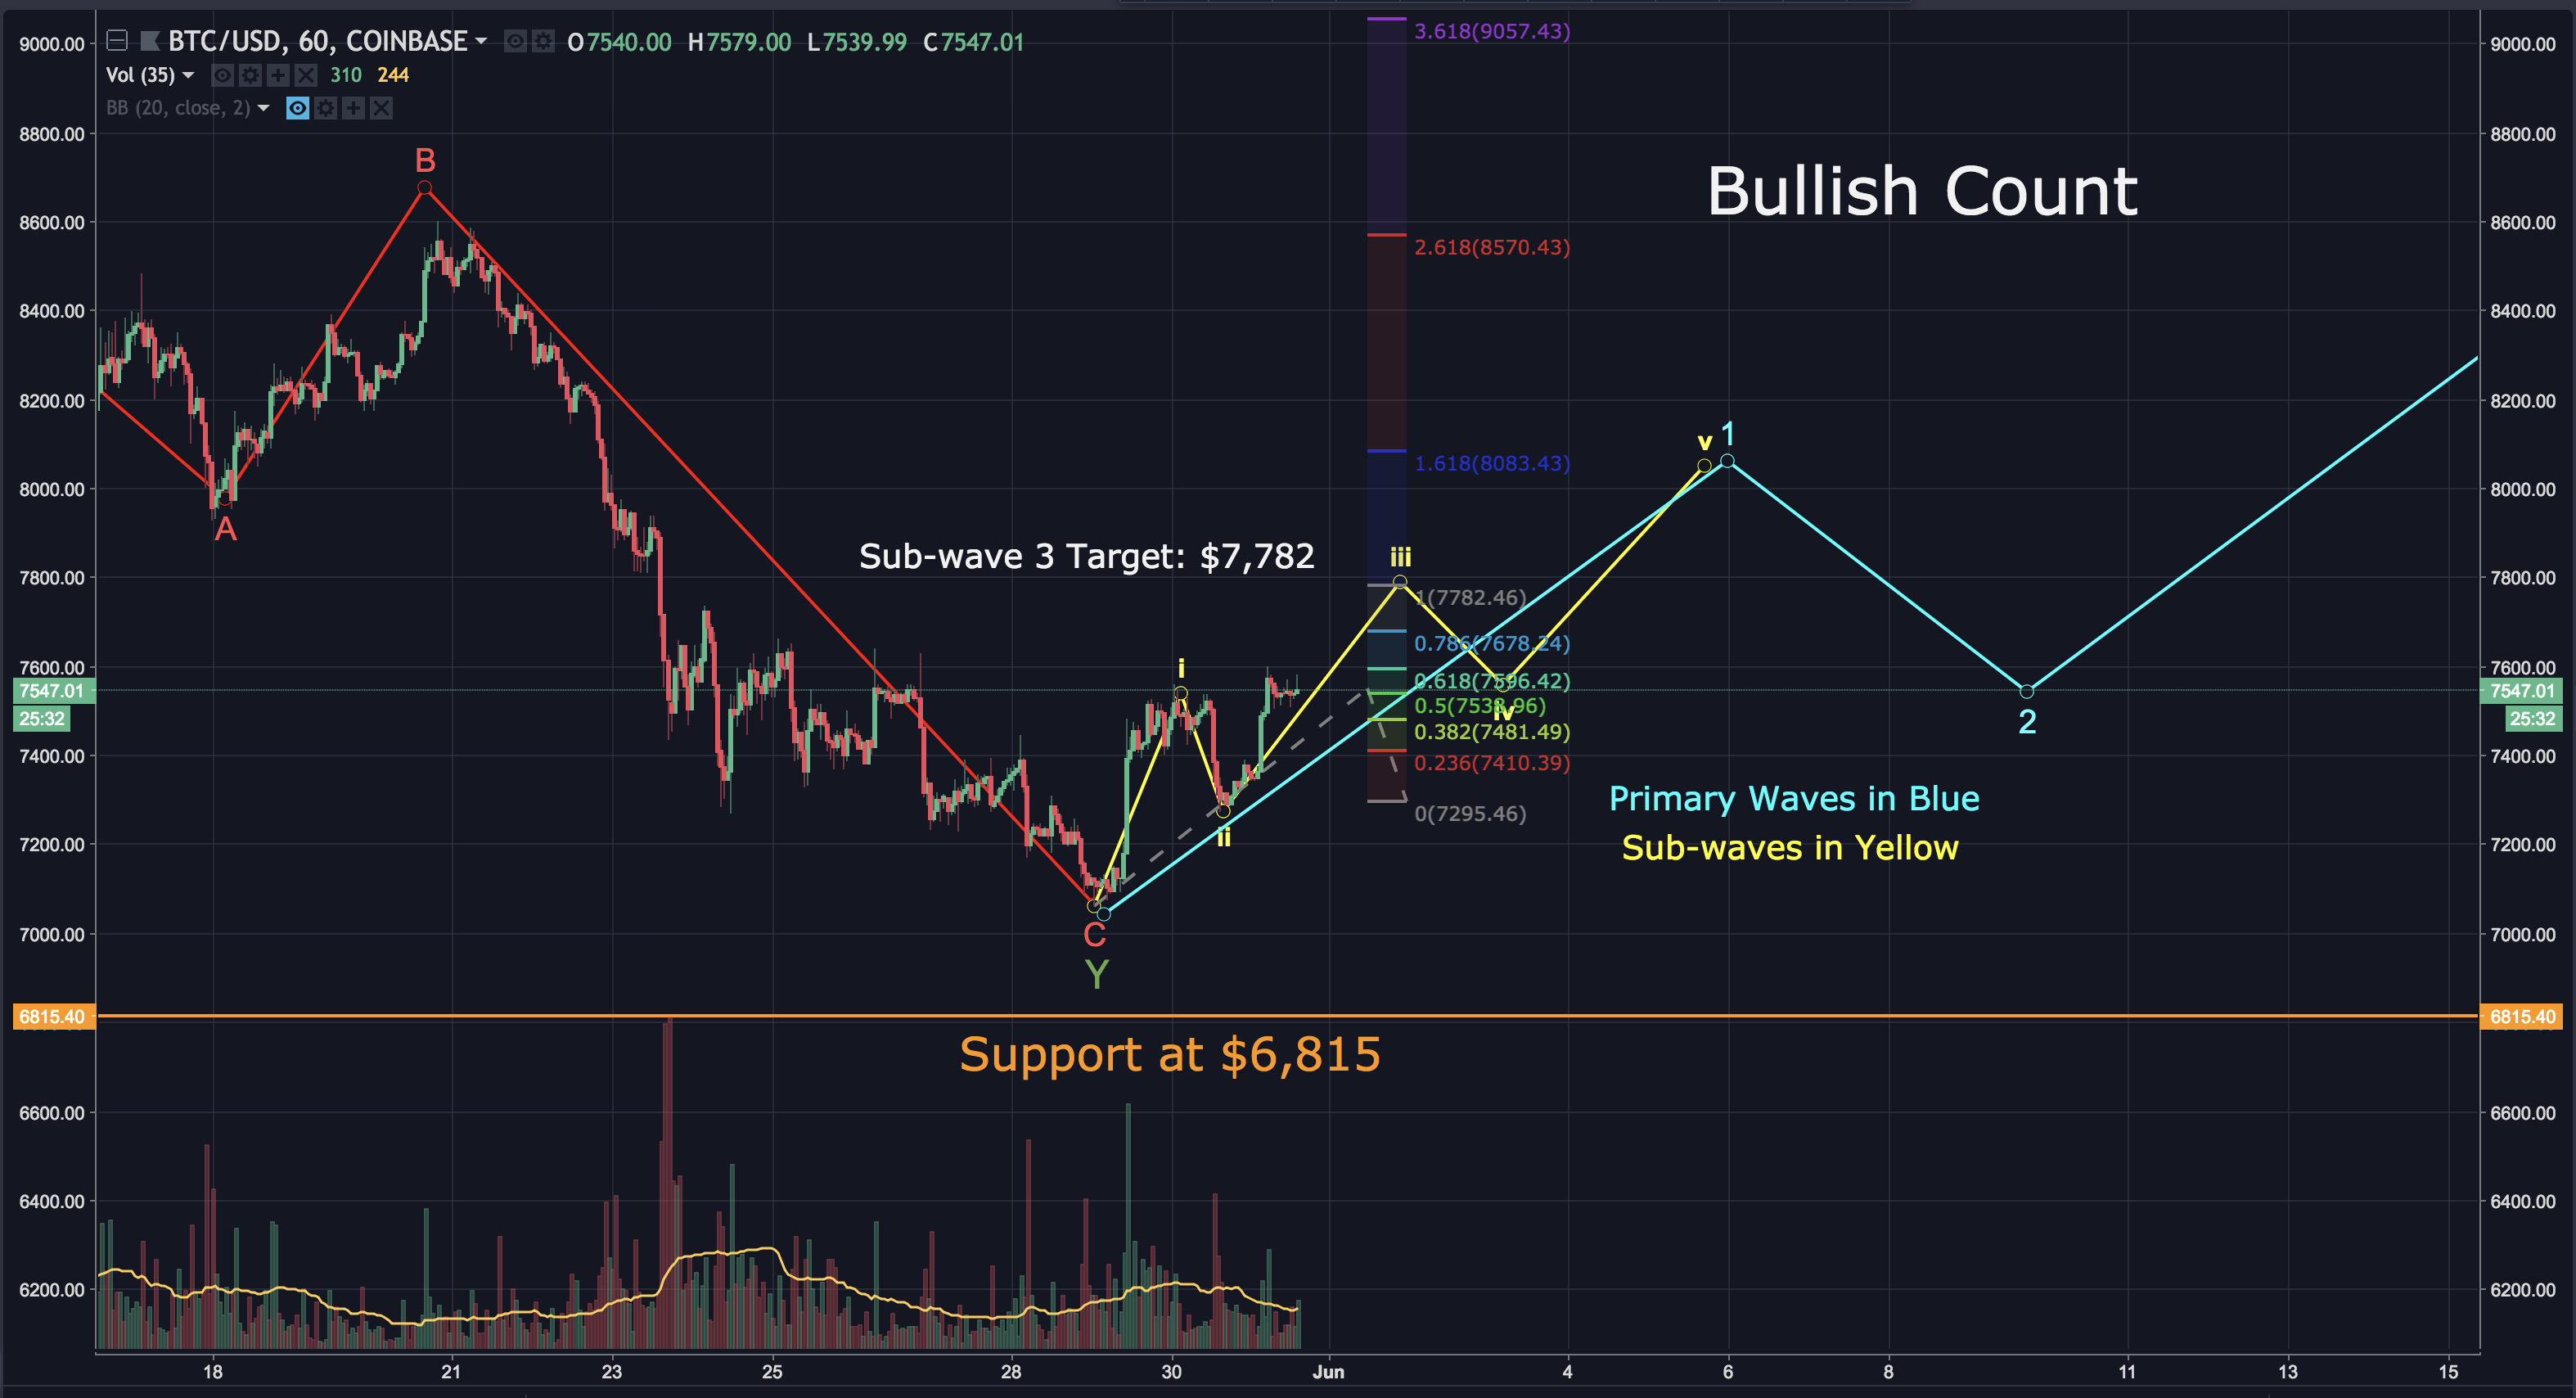
Zooming into the 1 hour chart, we can see it's on sub-wave 3, with an approximate target of $7,782. We need to see volume massively increase in order to validate this scenario.
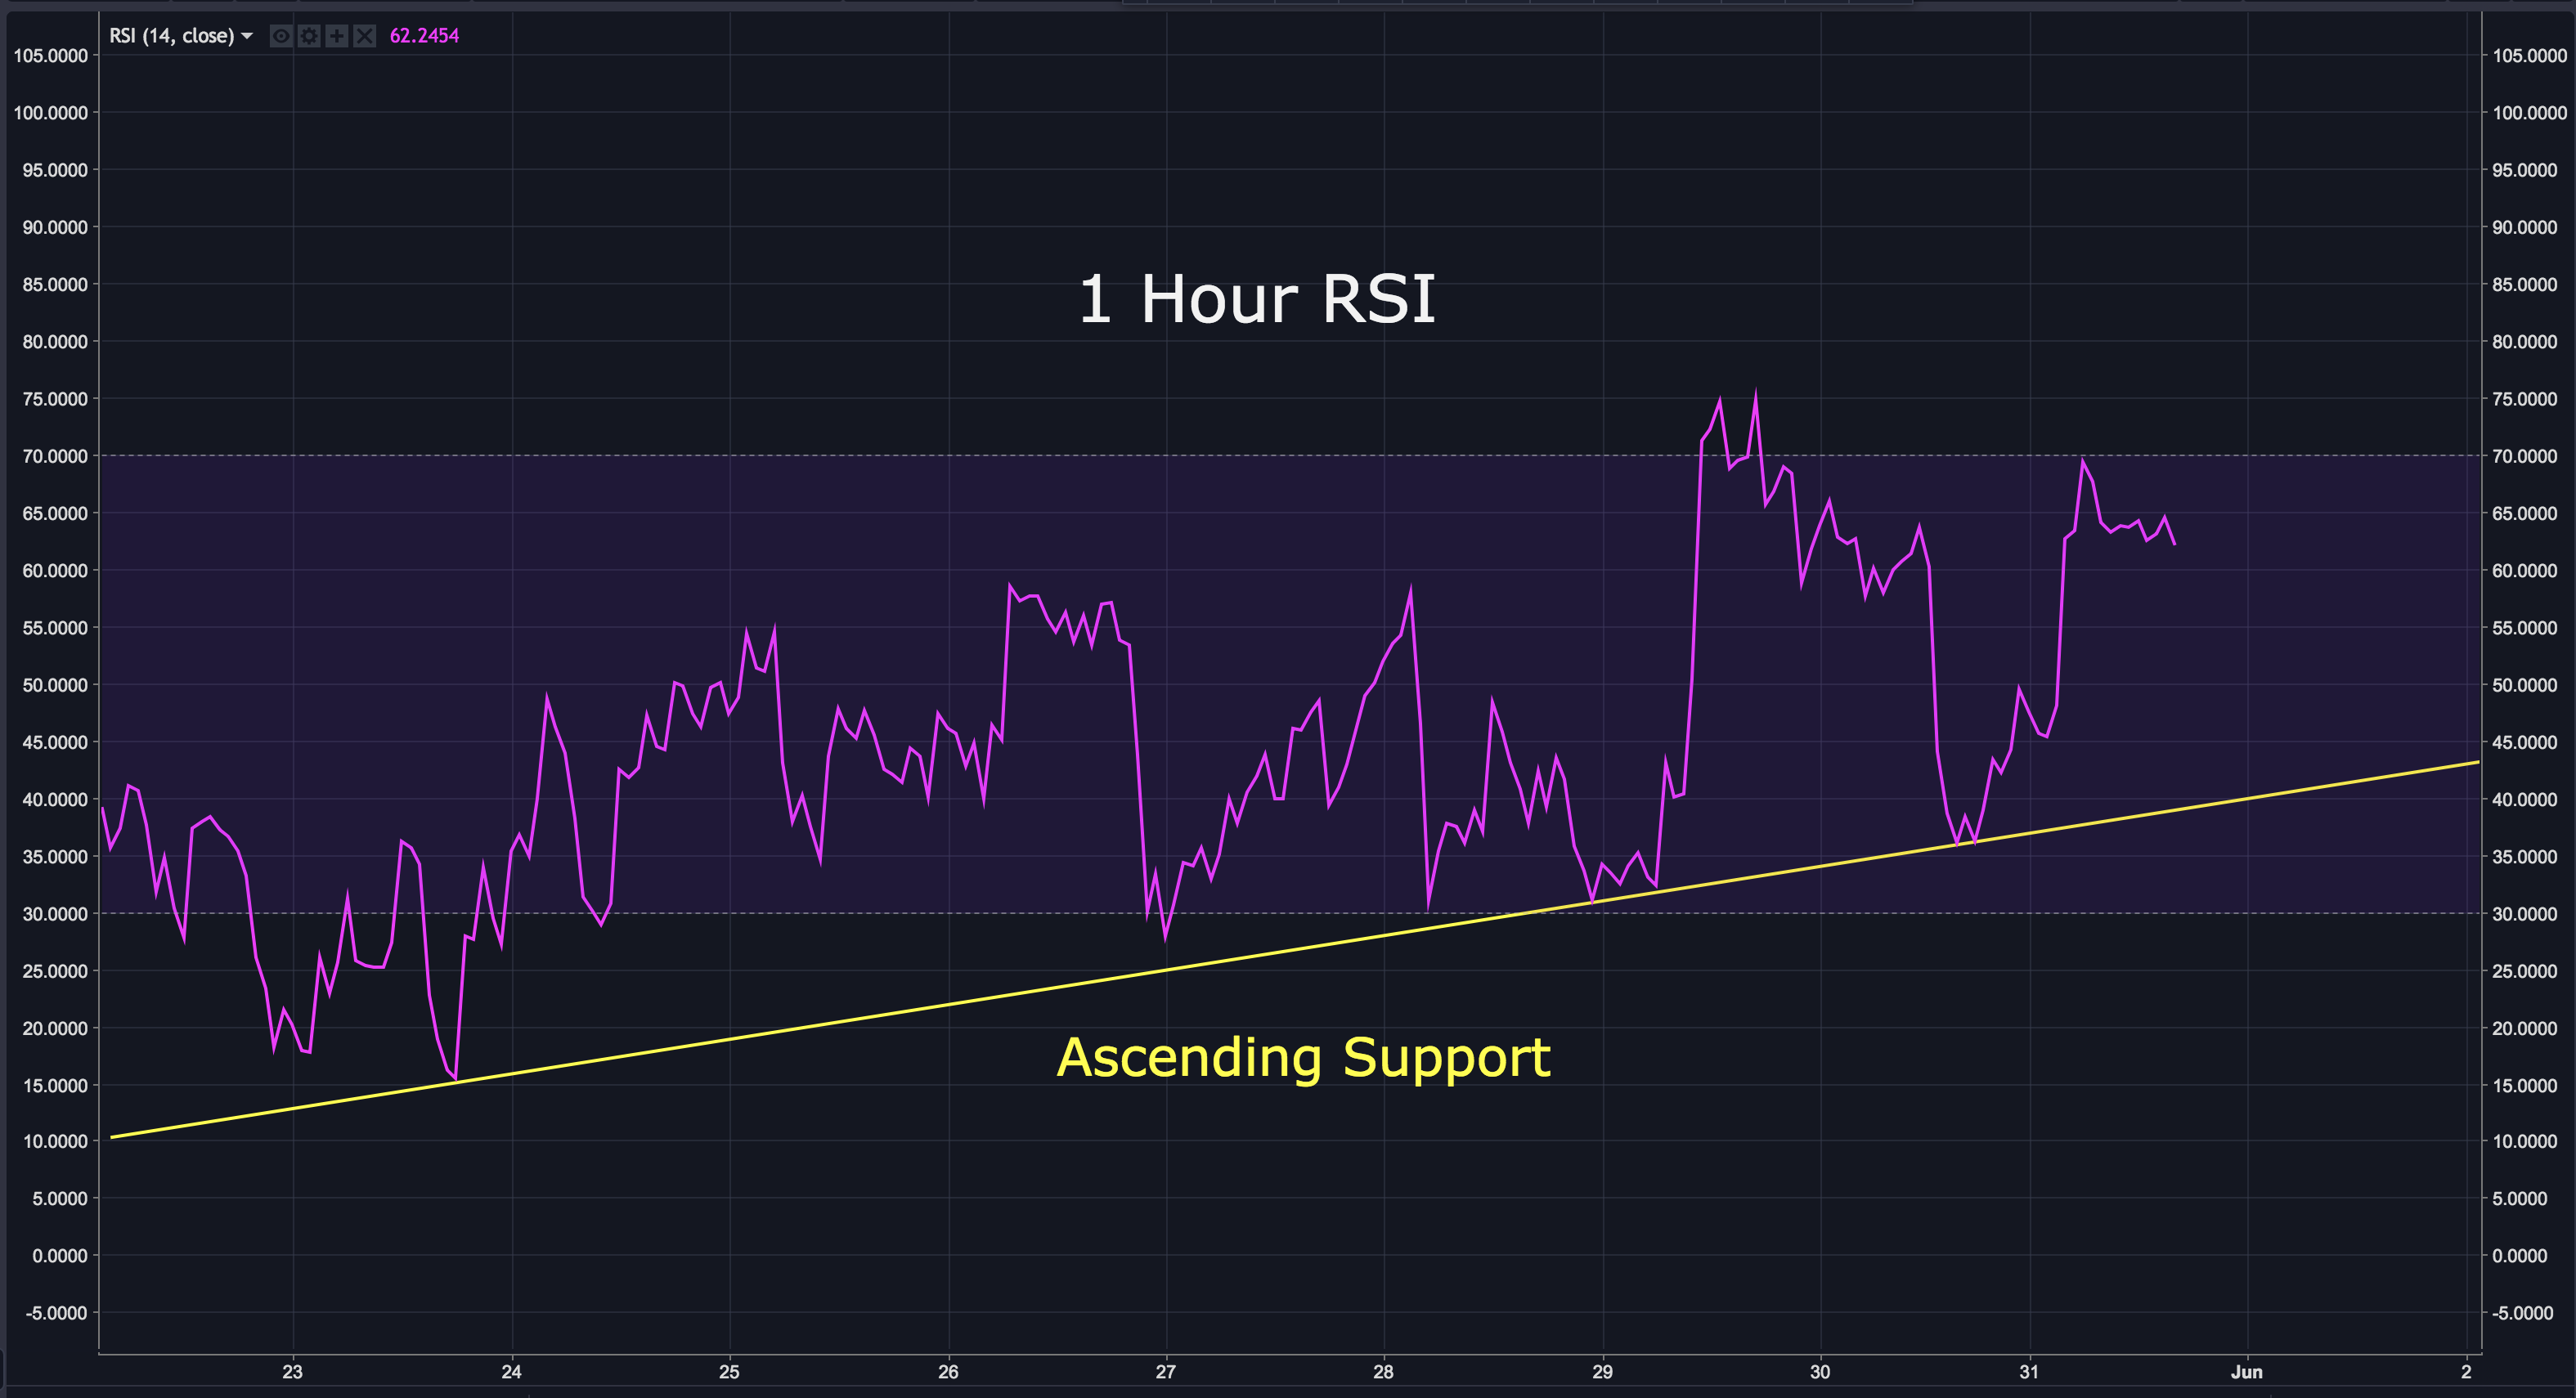
Looking at the 1 hour RSI, we can see an ascending support line has formed. If the bullish count is valid, this support needs to hold at least until sub-wave 3 is complete.
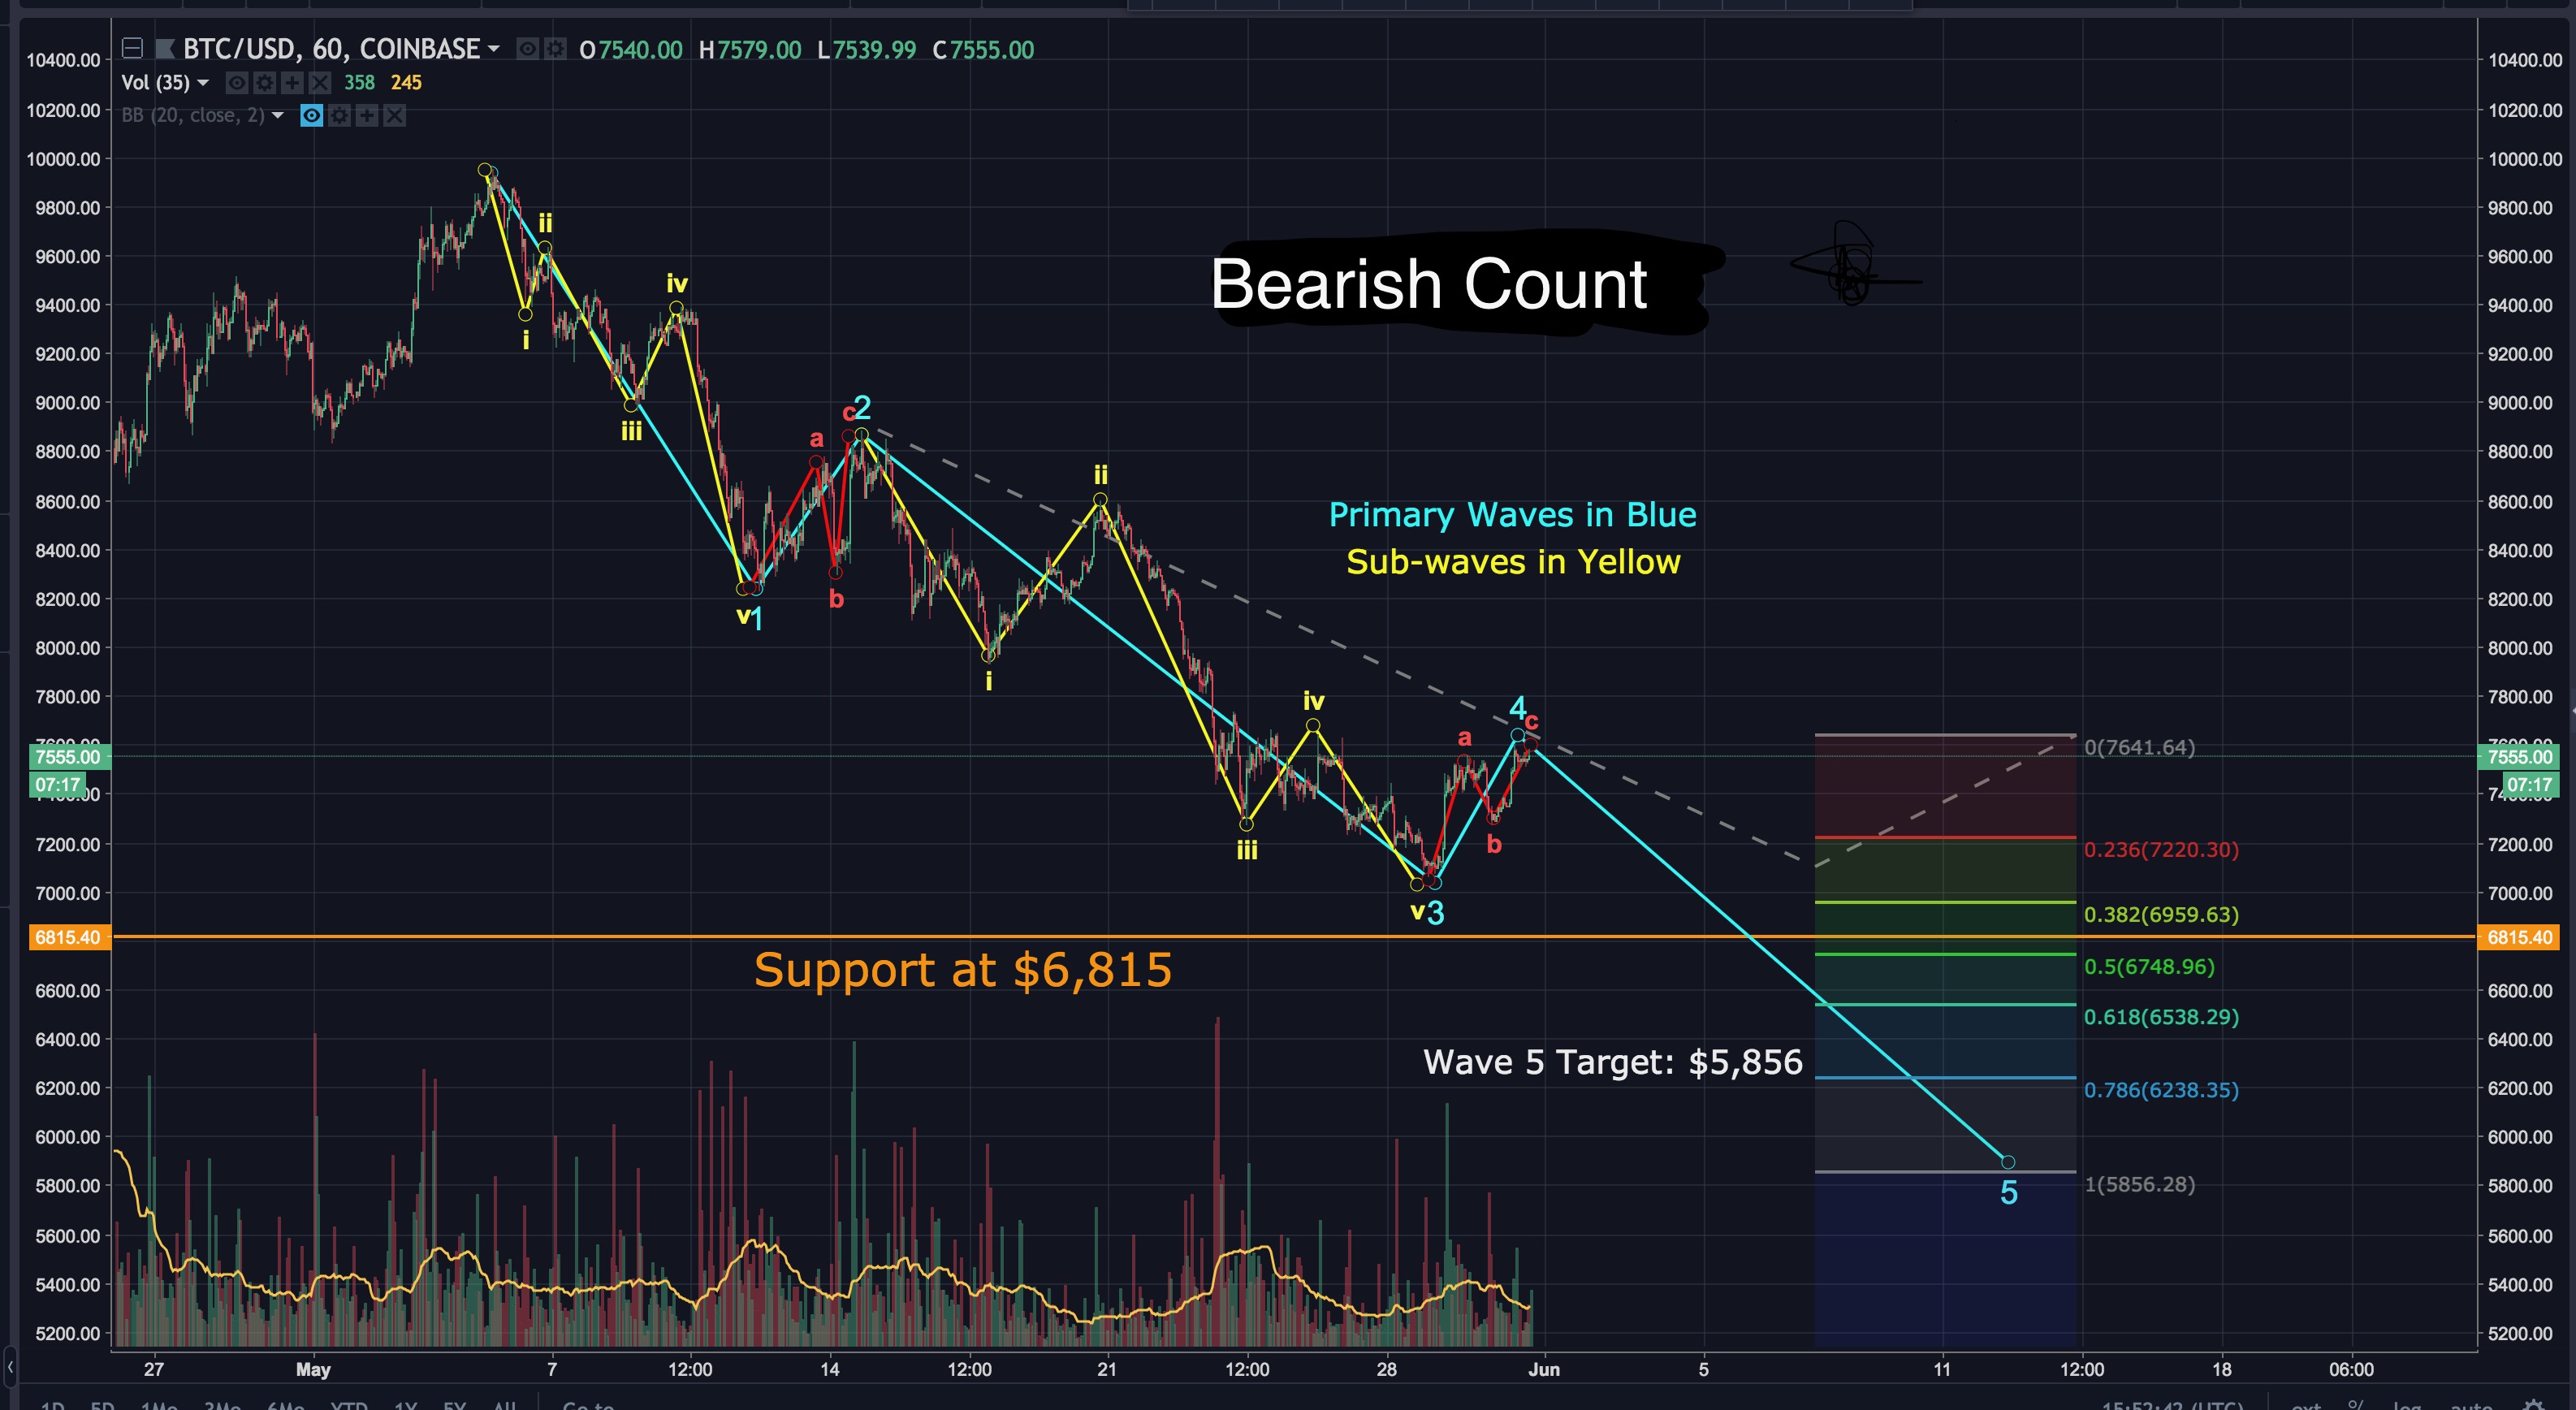
The bearish count has bitcoin in 5 waves down. Wave 4 looks to be nearly finished. As I mentioned before, the support at $6,815 is fairly strong. If this count is accurate, we may see a truncated 5th wave around that support zone. If it does manage to drop below the $6,815 support, the target for wave 5 in this count is approximately $5,856. Here's how it may play out:
The market continues to send MANY mixed signals. Here's just a few...
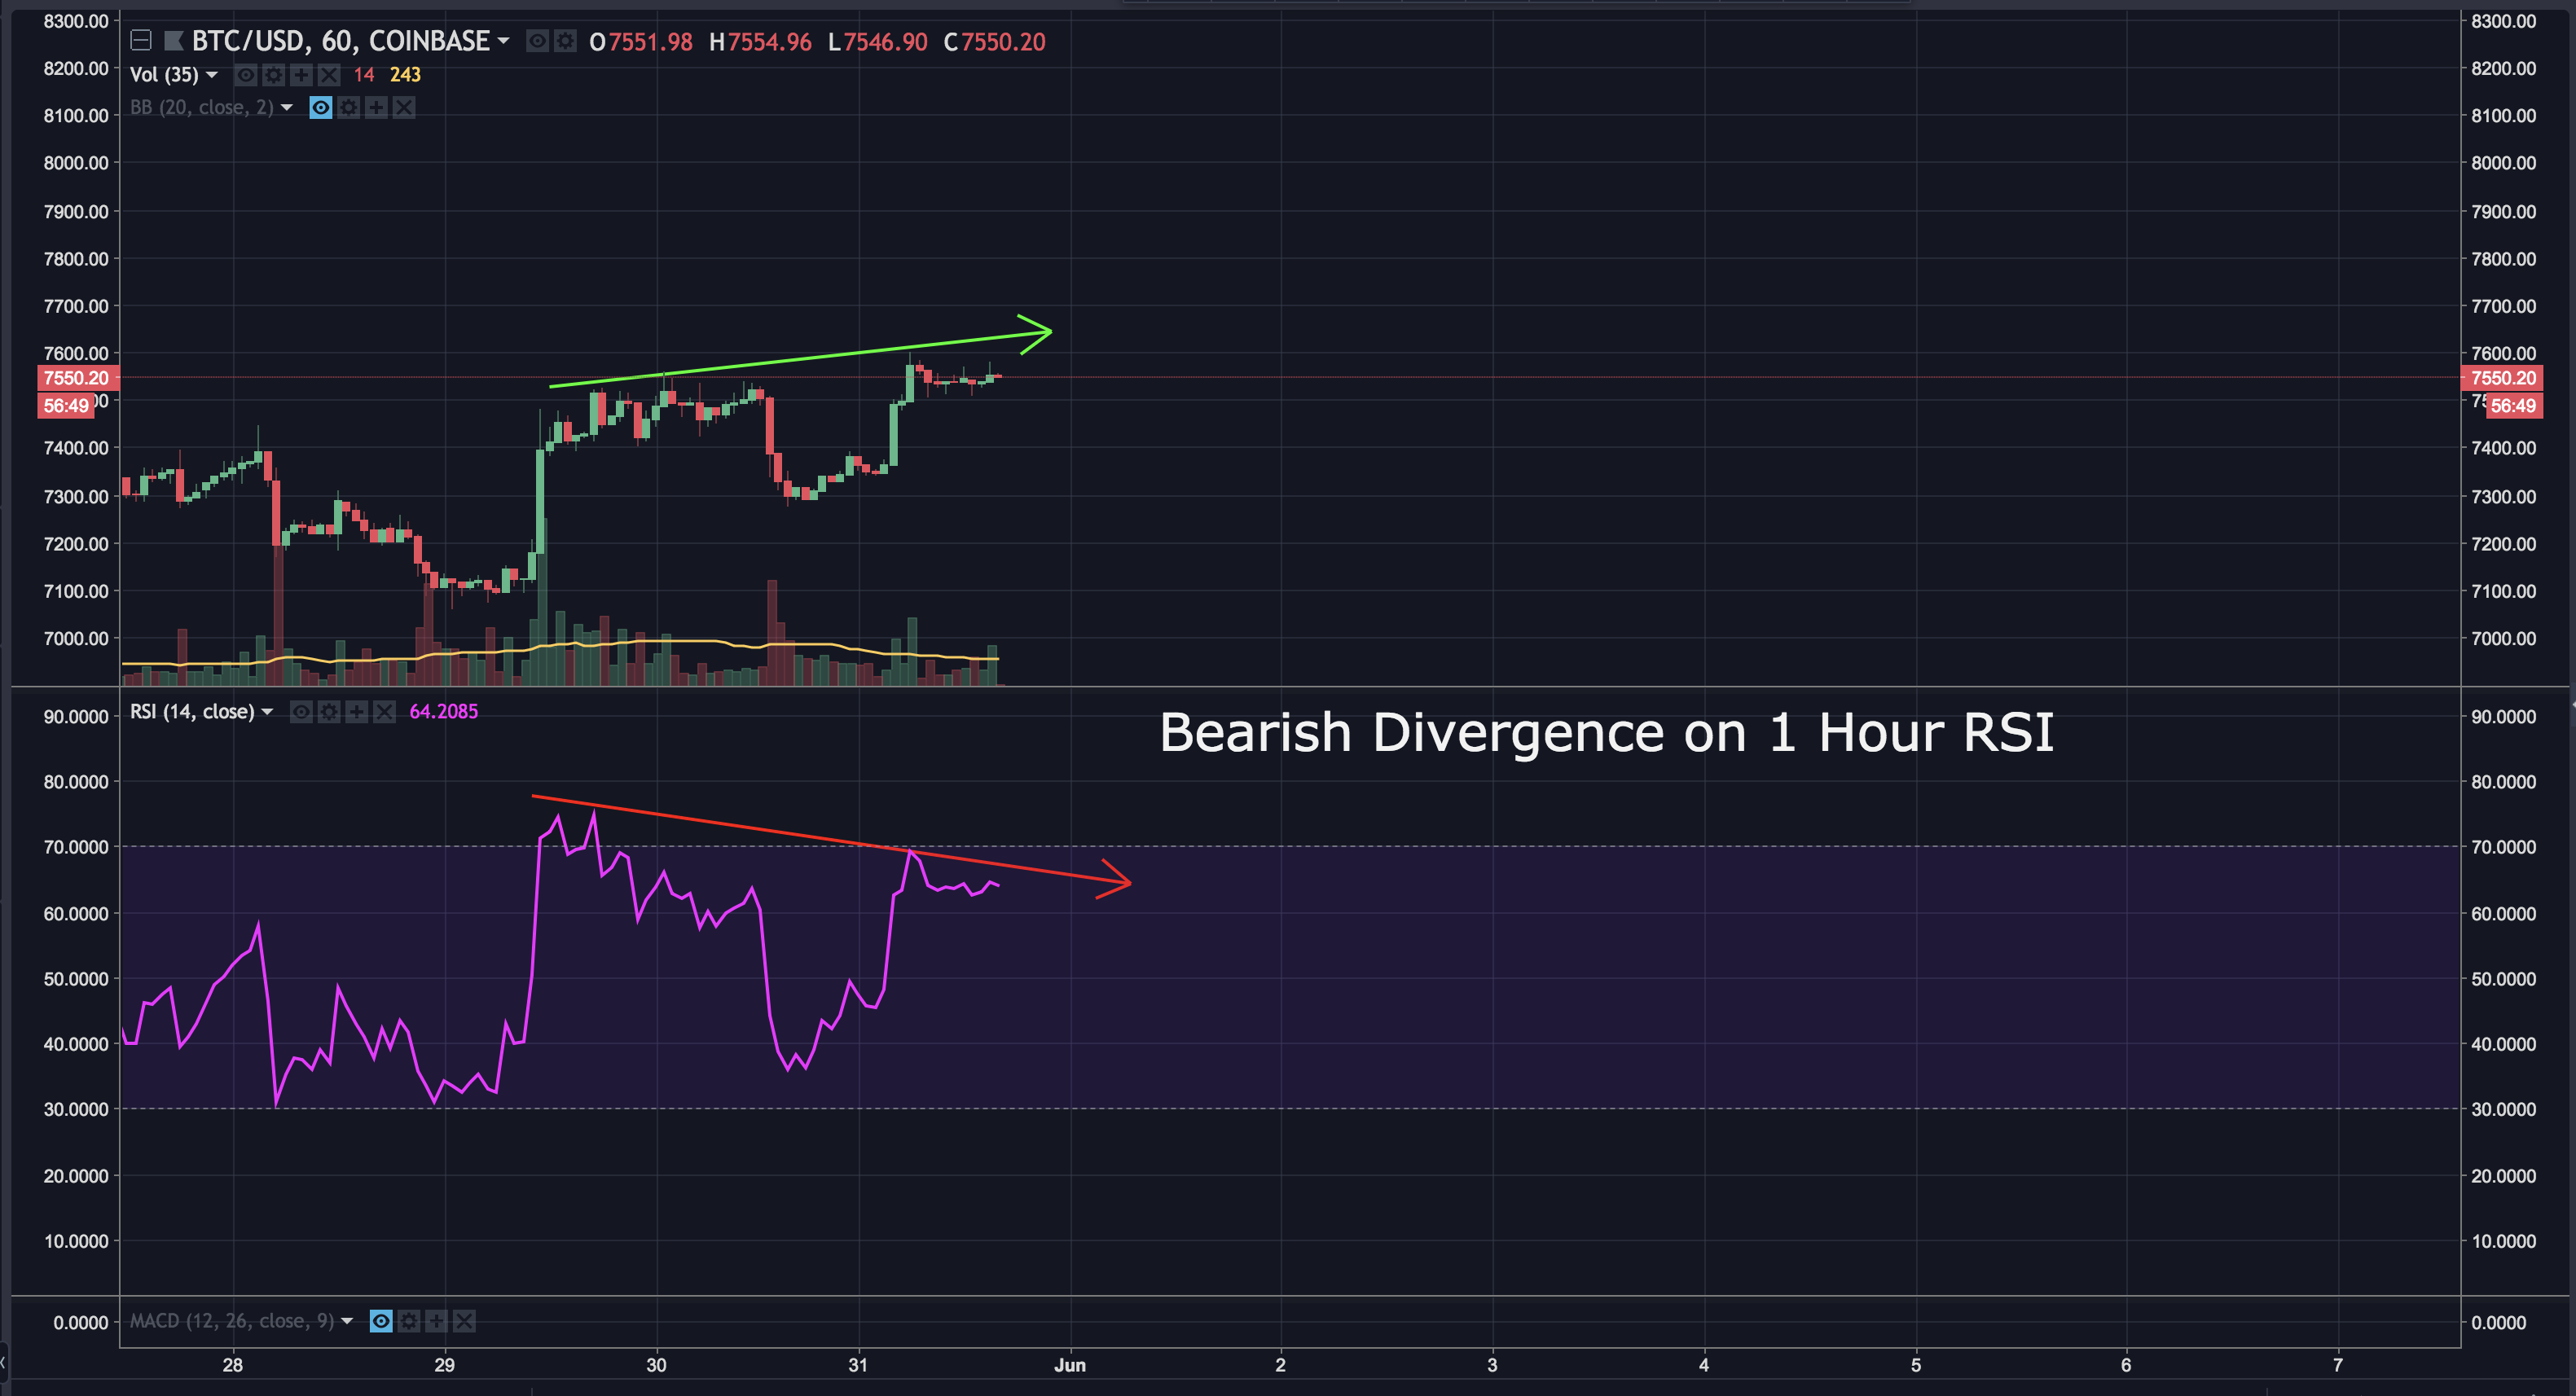
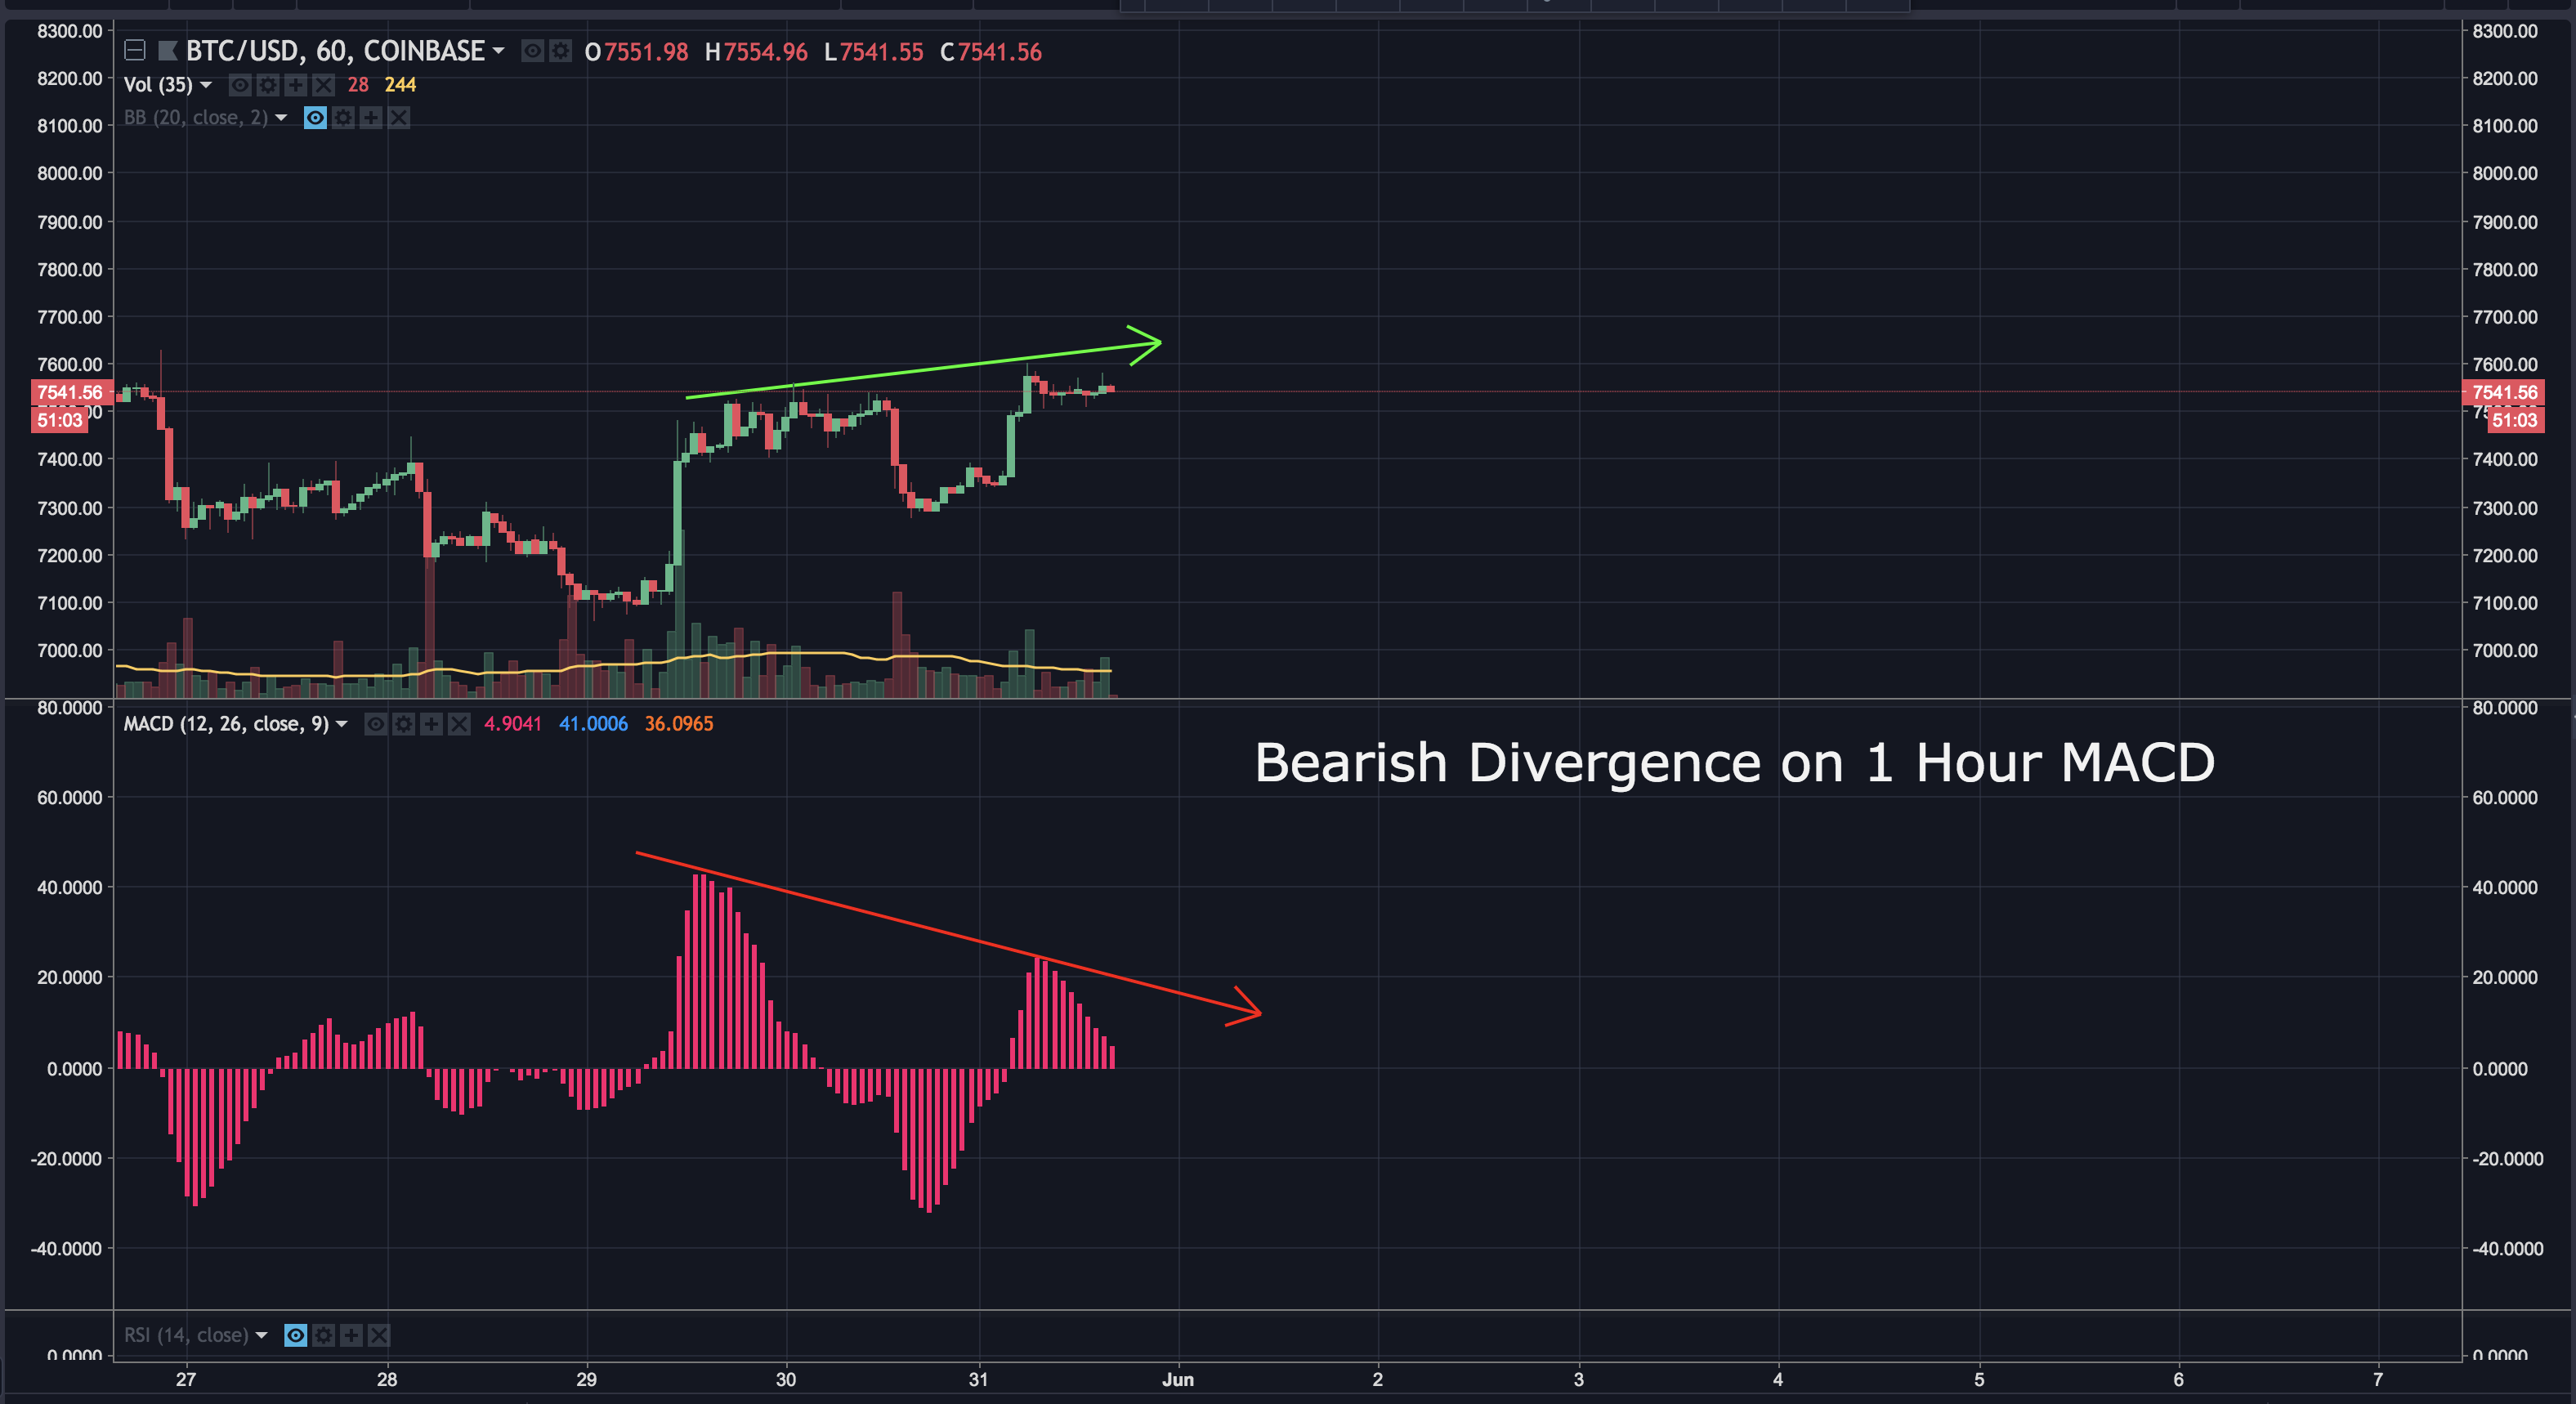
Looking at the 1 hour RSI and 1 hour MACD, we can see bearish divergence. This may indicate a drop in price is coming.
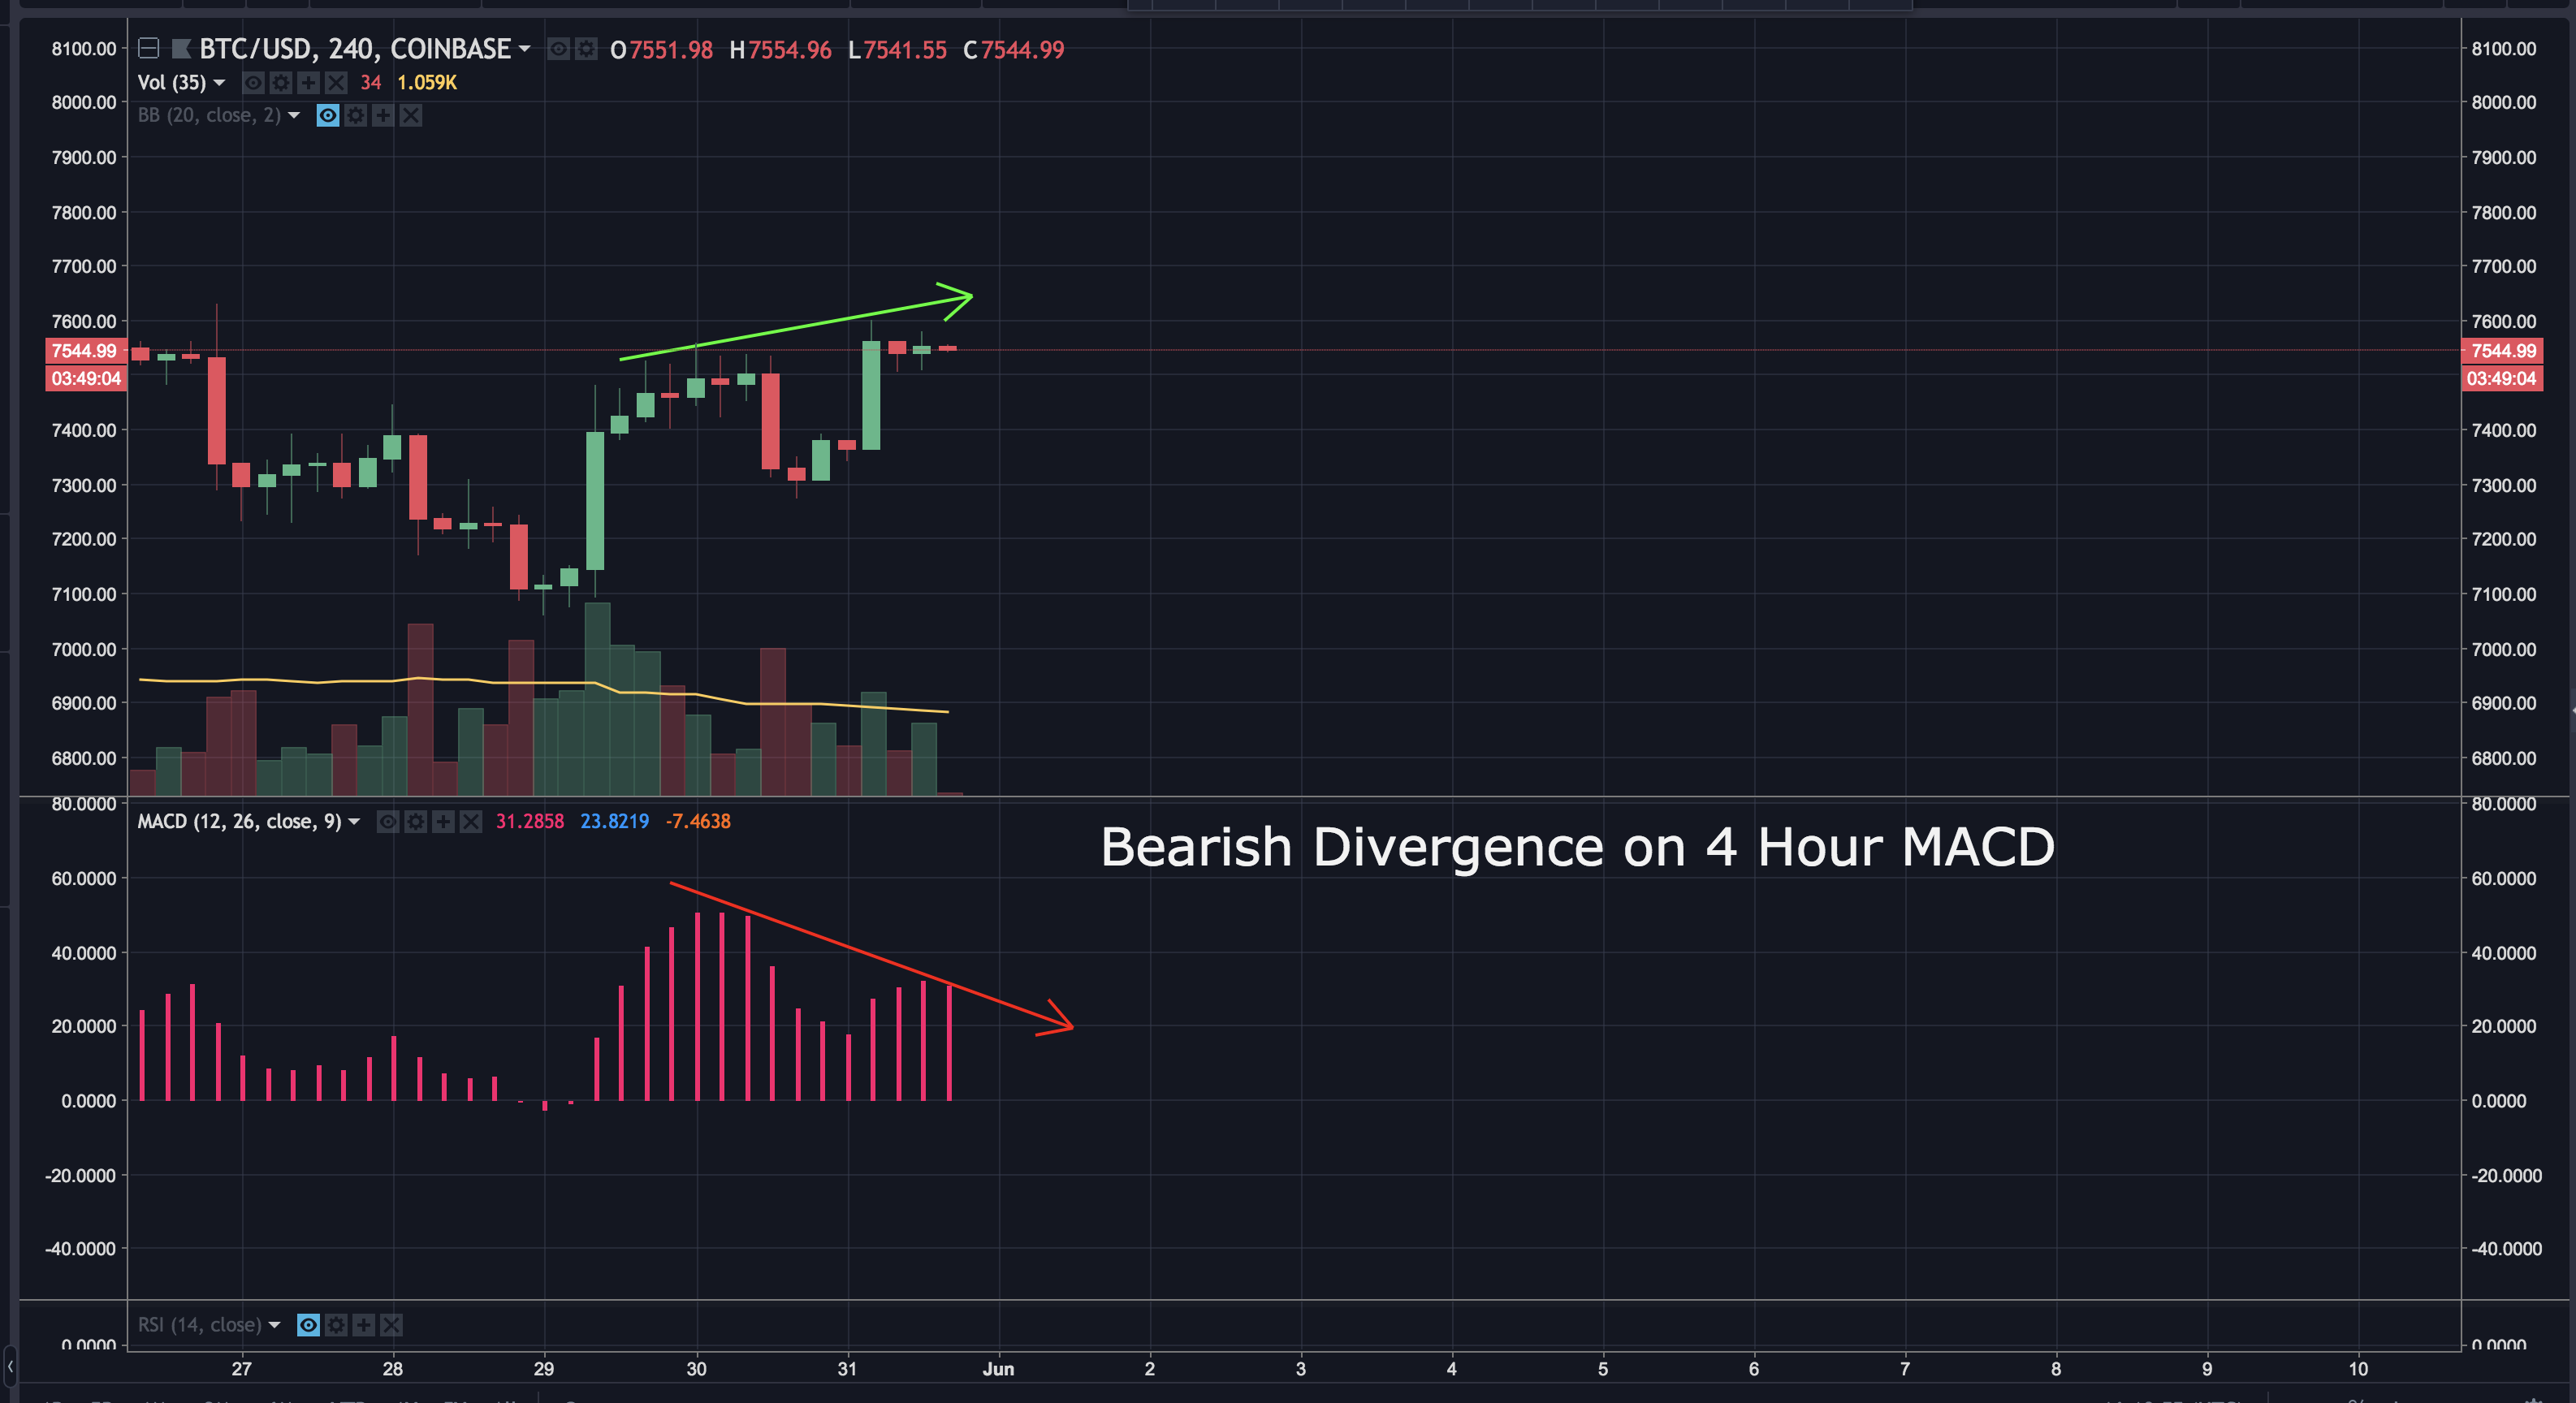
The 4 hour MACD is also showing bearish divergence...although the 4 hour RSI does not.
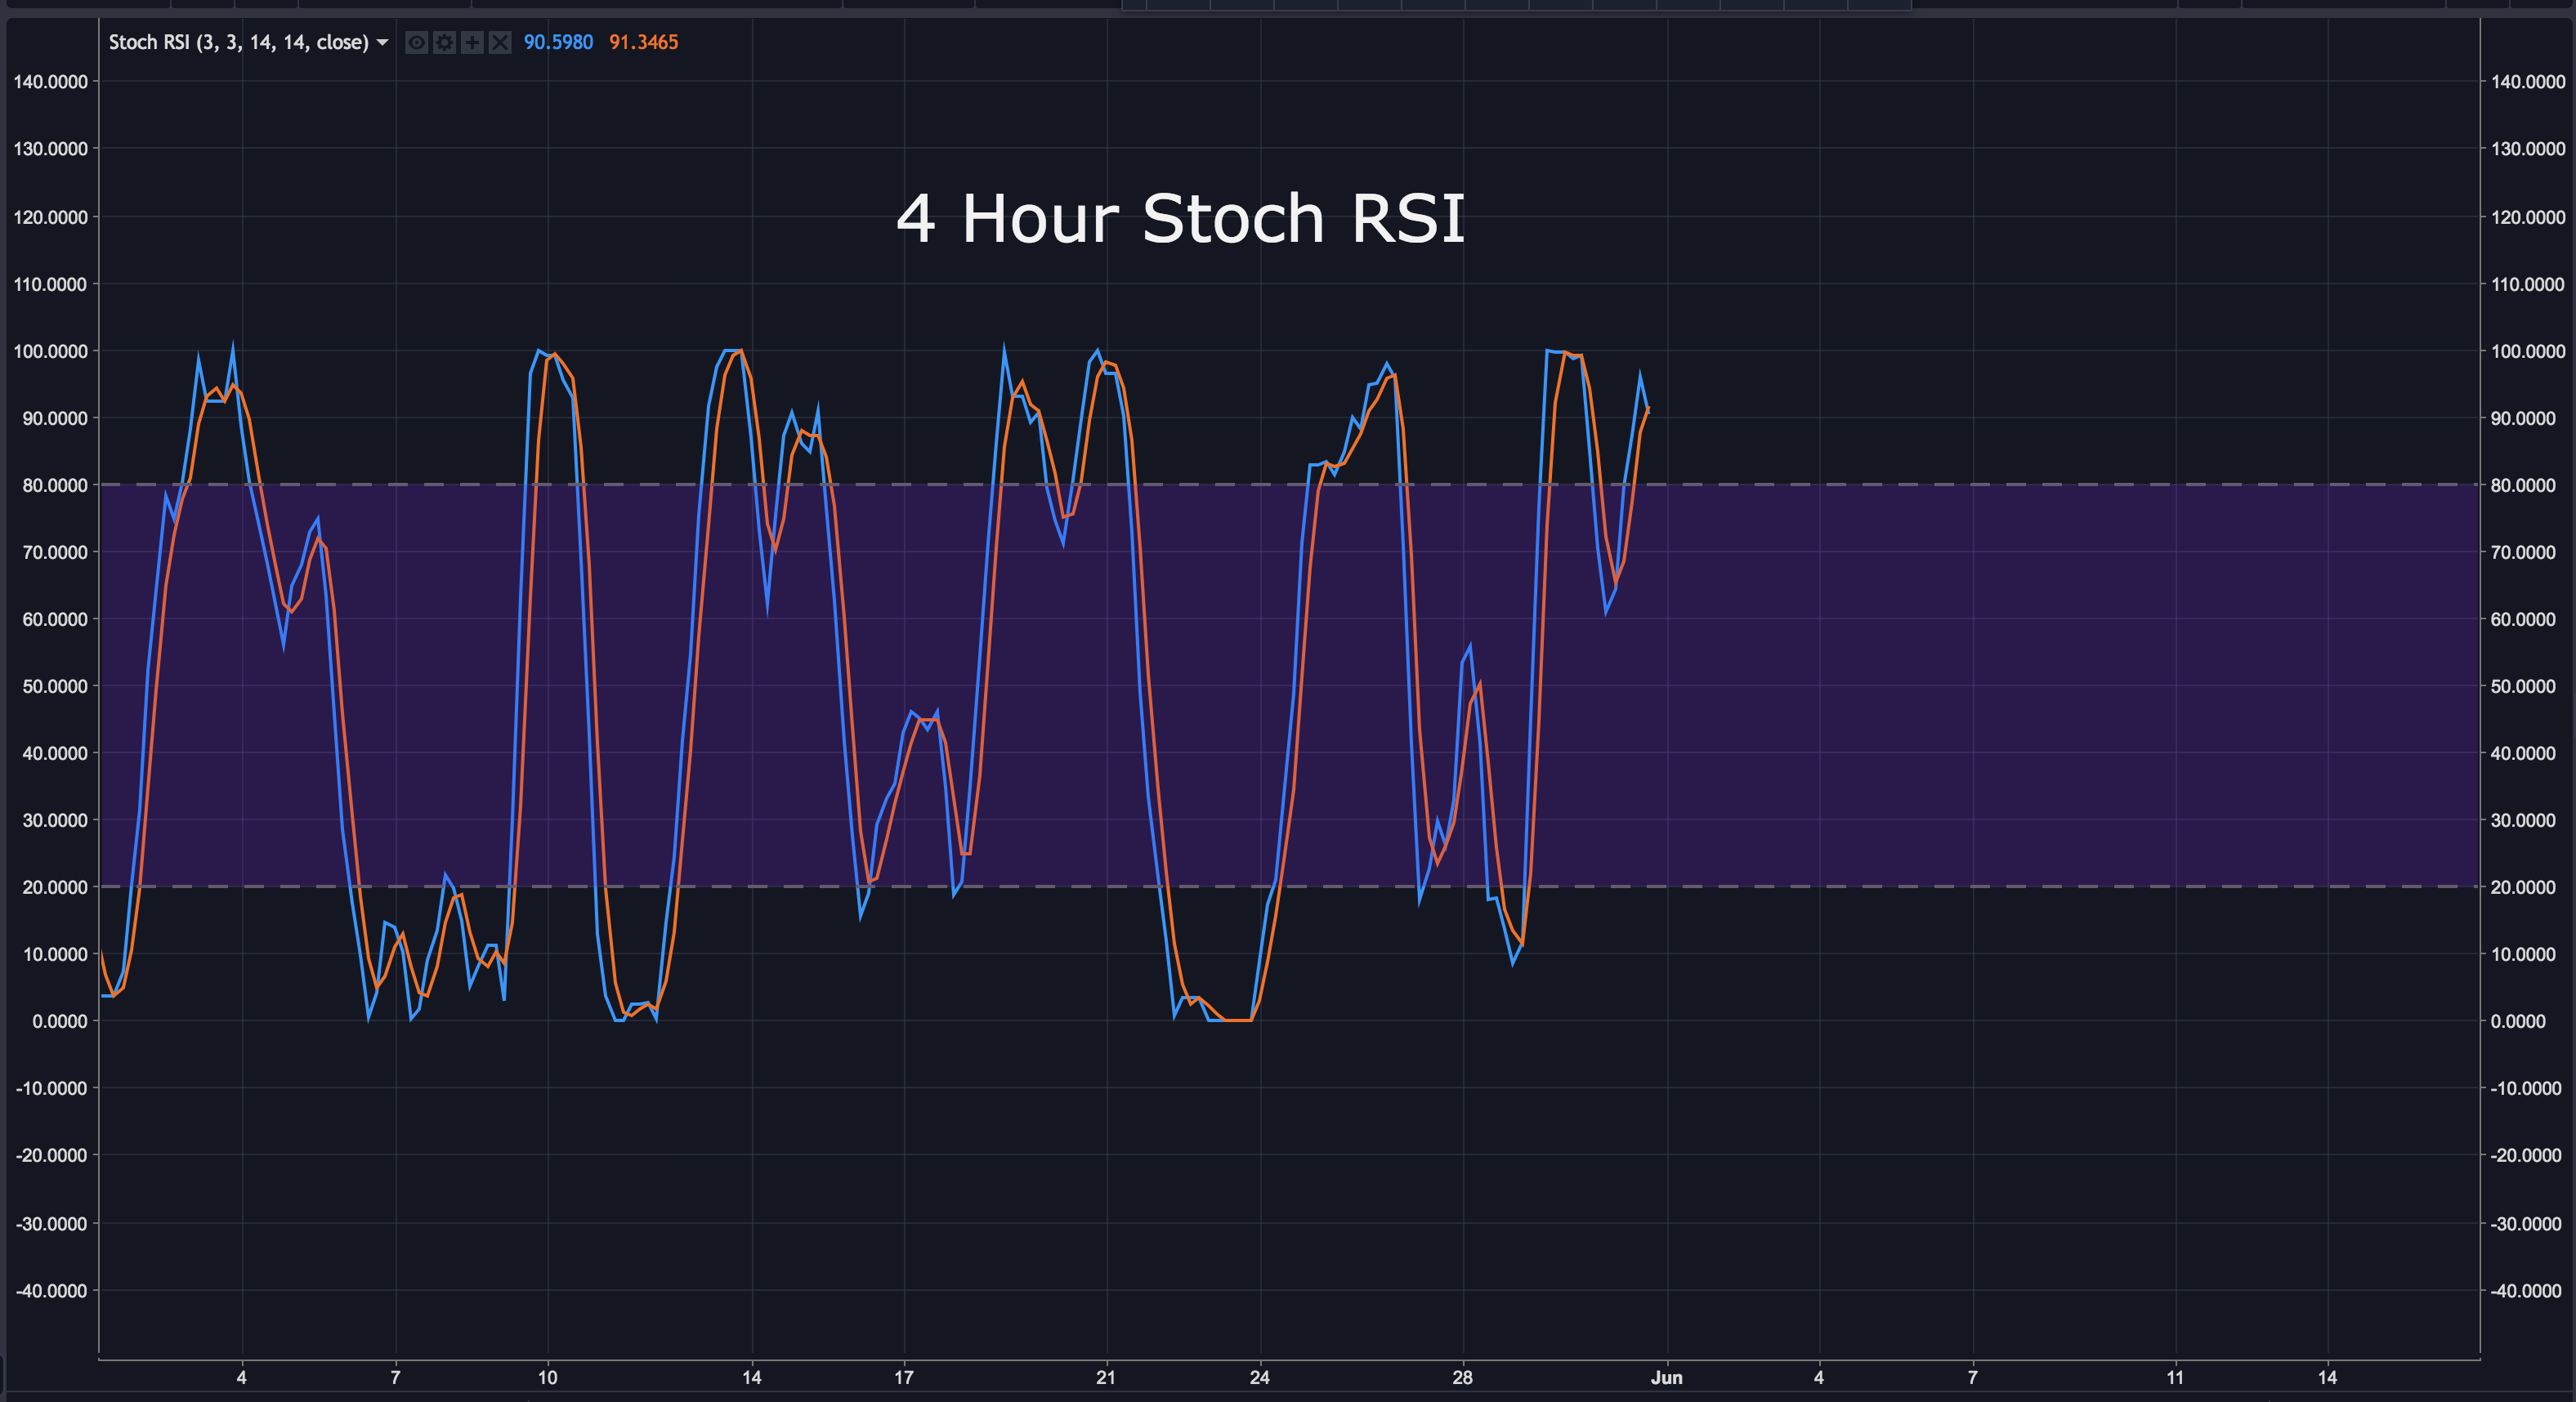
The 4 hour Stoch RSI looks oversold and needs a temporary correction to reset.
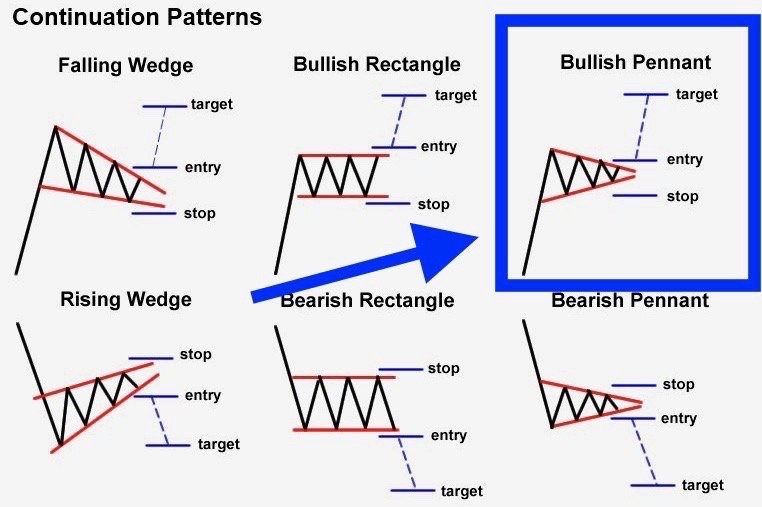
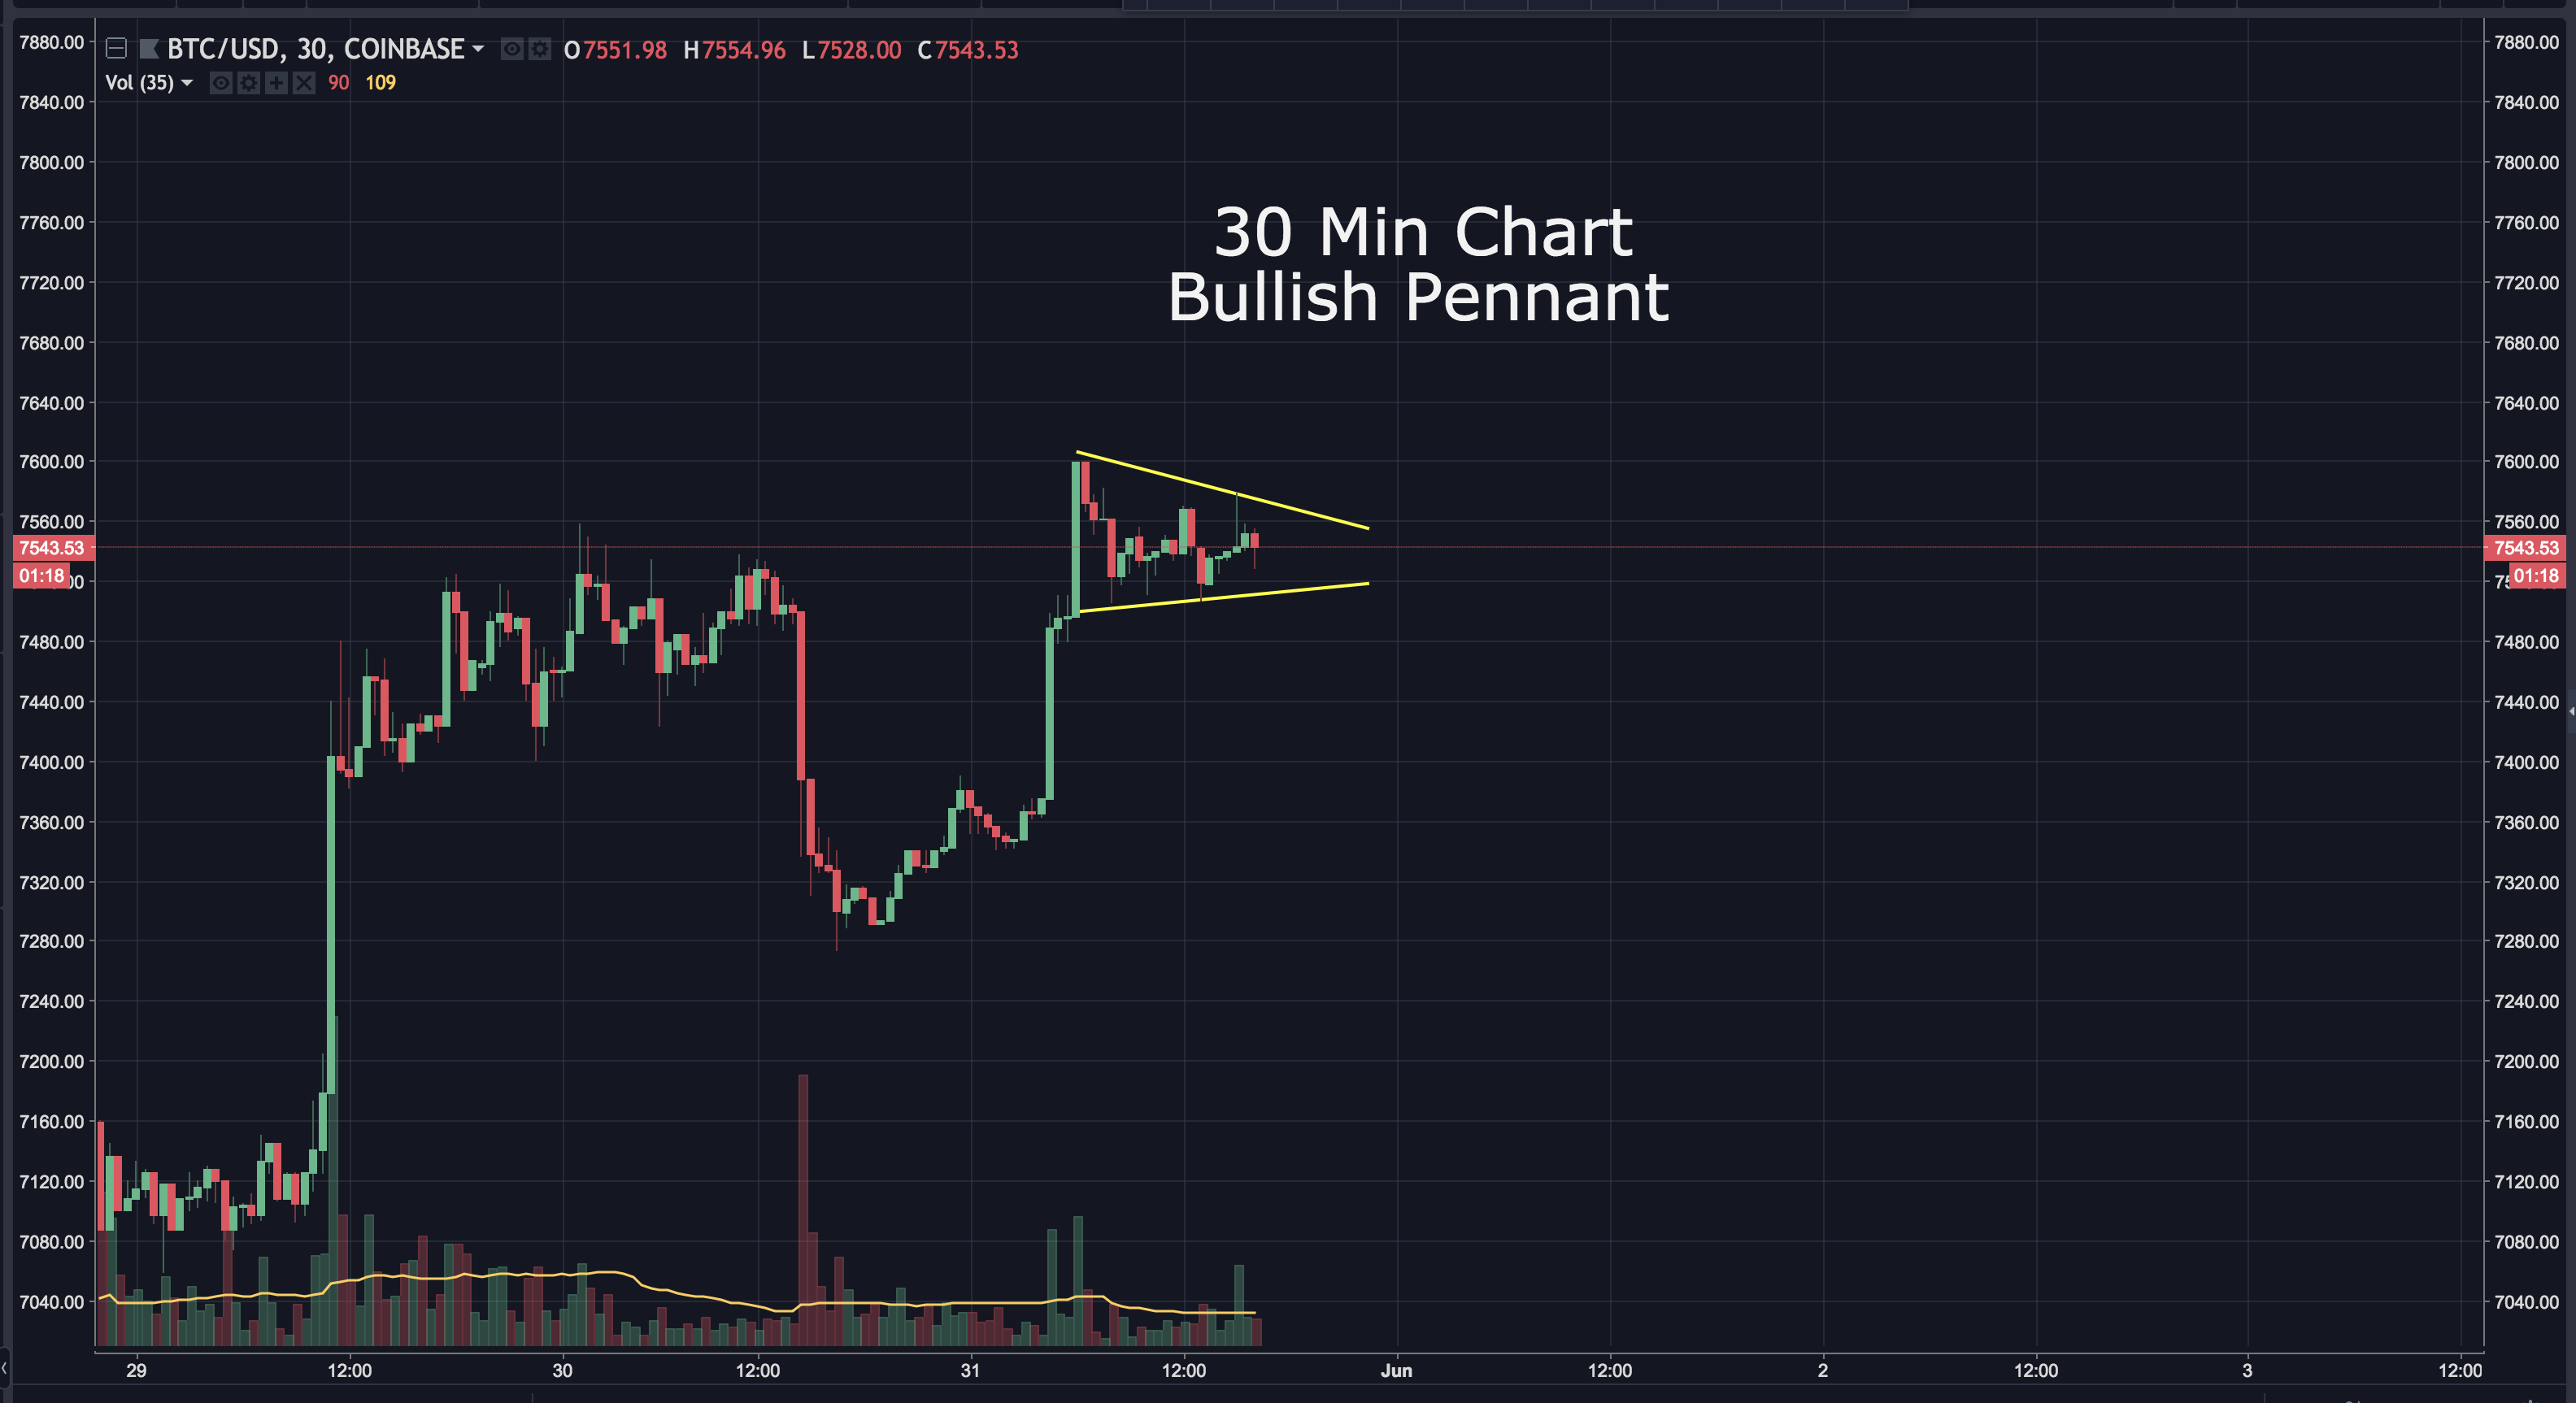
Zooming into the 30 min chart, we can see a bullish pennant has formed. This suggests a rise in price (at least temporarily) may take place.
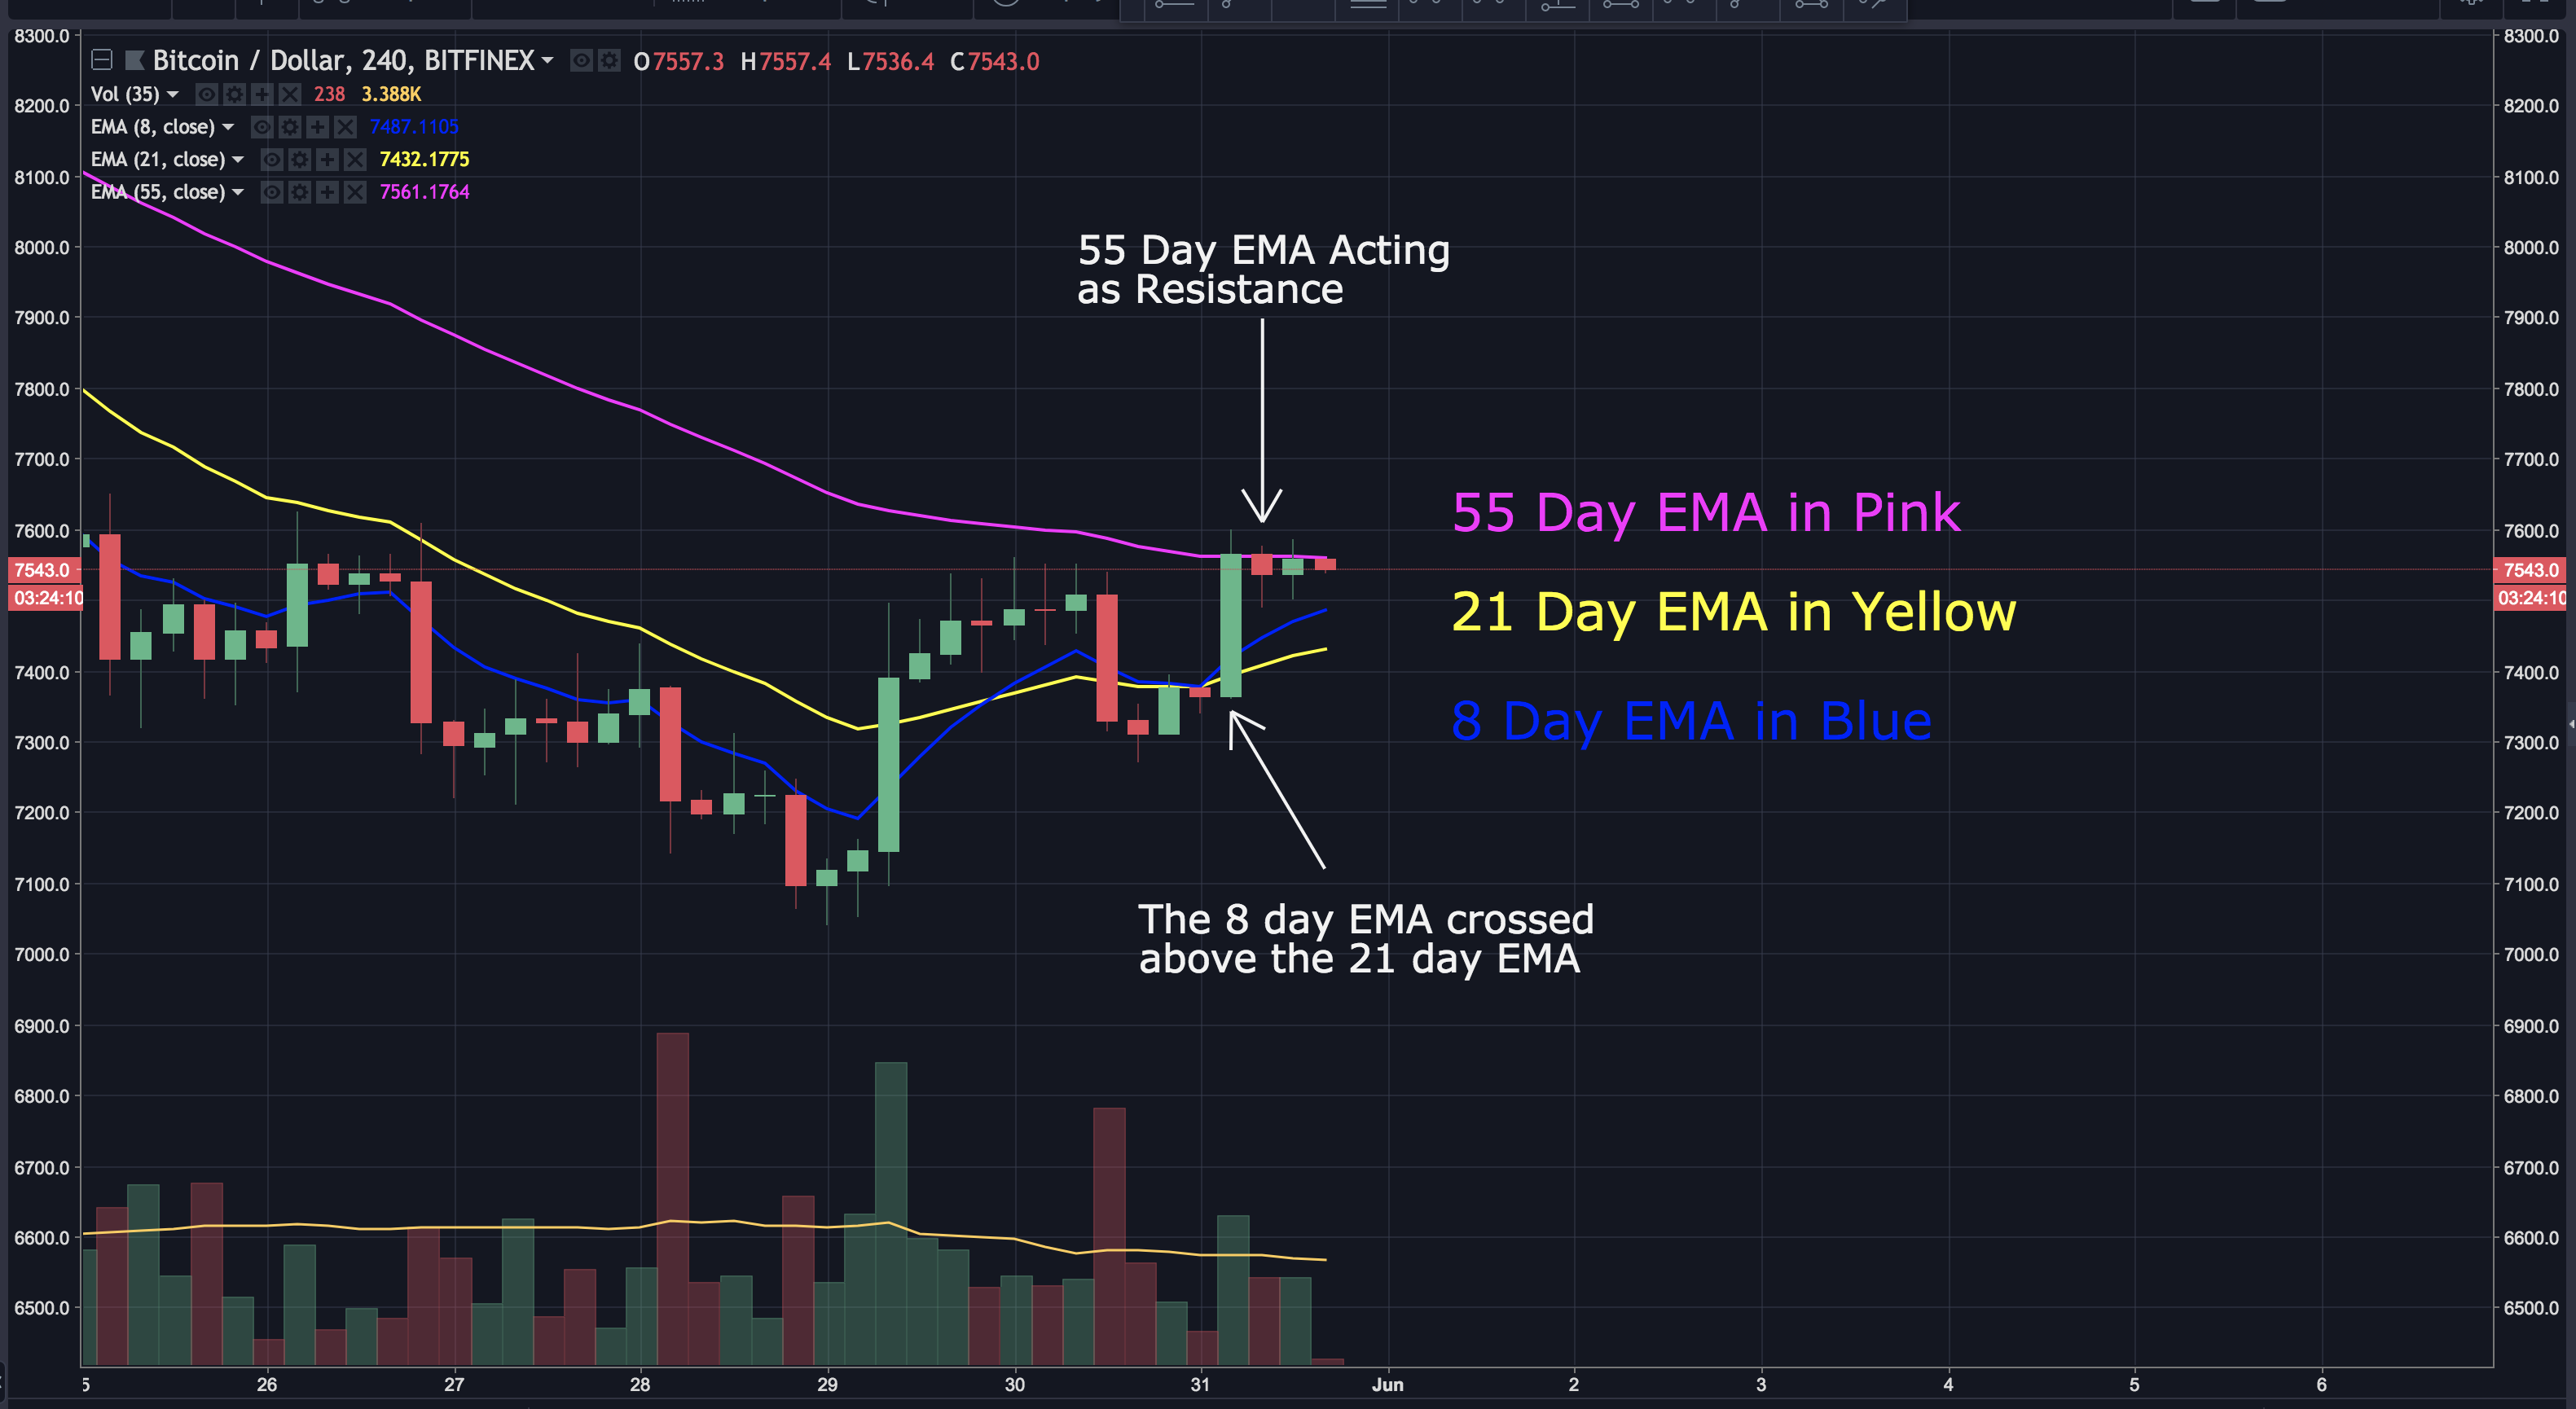
The 8 day EMA has decisively risen above the 21 day, which is a sign of a strengthening market. The 55 day EMA is currently acting as resistance. A break above the 55 day would be another very bullish indication.
These are just a few of the mixed signals the market is sending right now. It's clear one could build a case for bitcoin to go on a bull-run, or bear-run in the next few days.
Zooming out and looking at the big picture, you can see it's still operating with the wedge I first pointed out a couple weeks ago. As it moves closer to the apex, we can expect Bitcoin to decisively break in one direction or another.
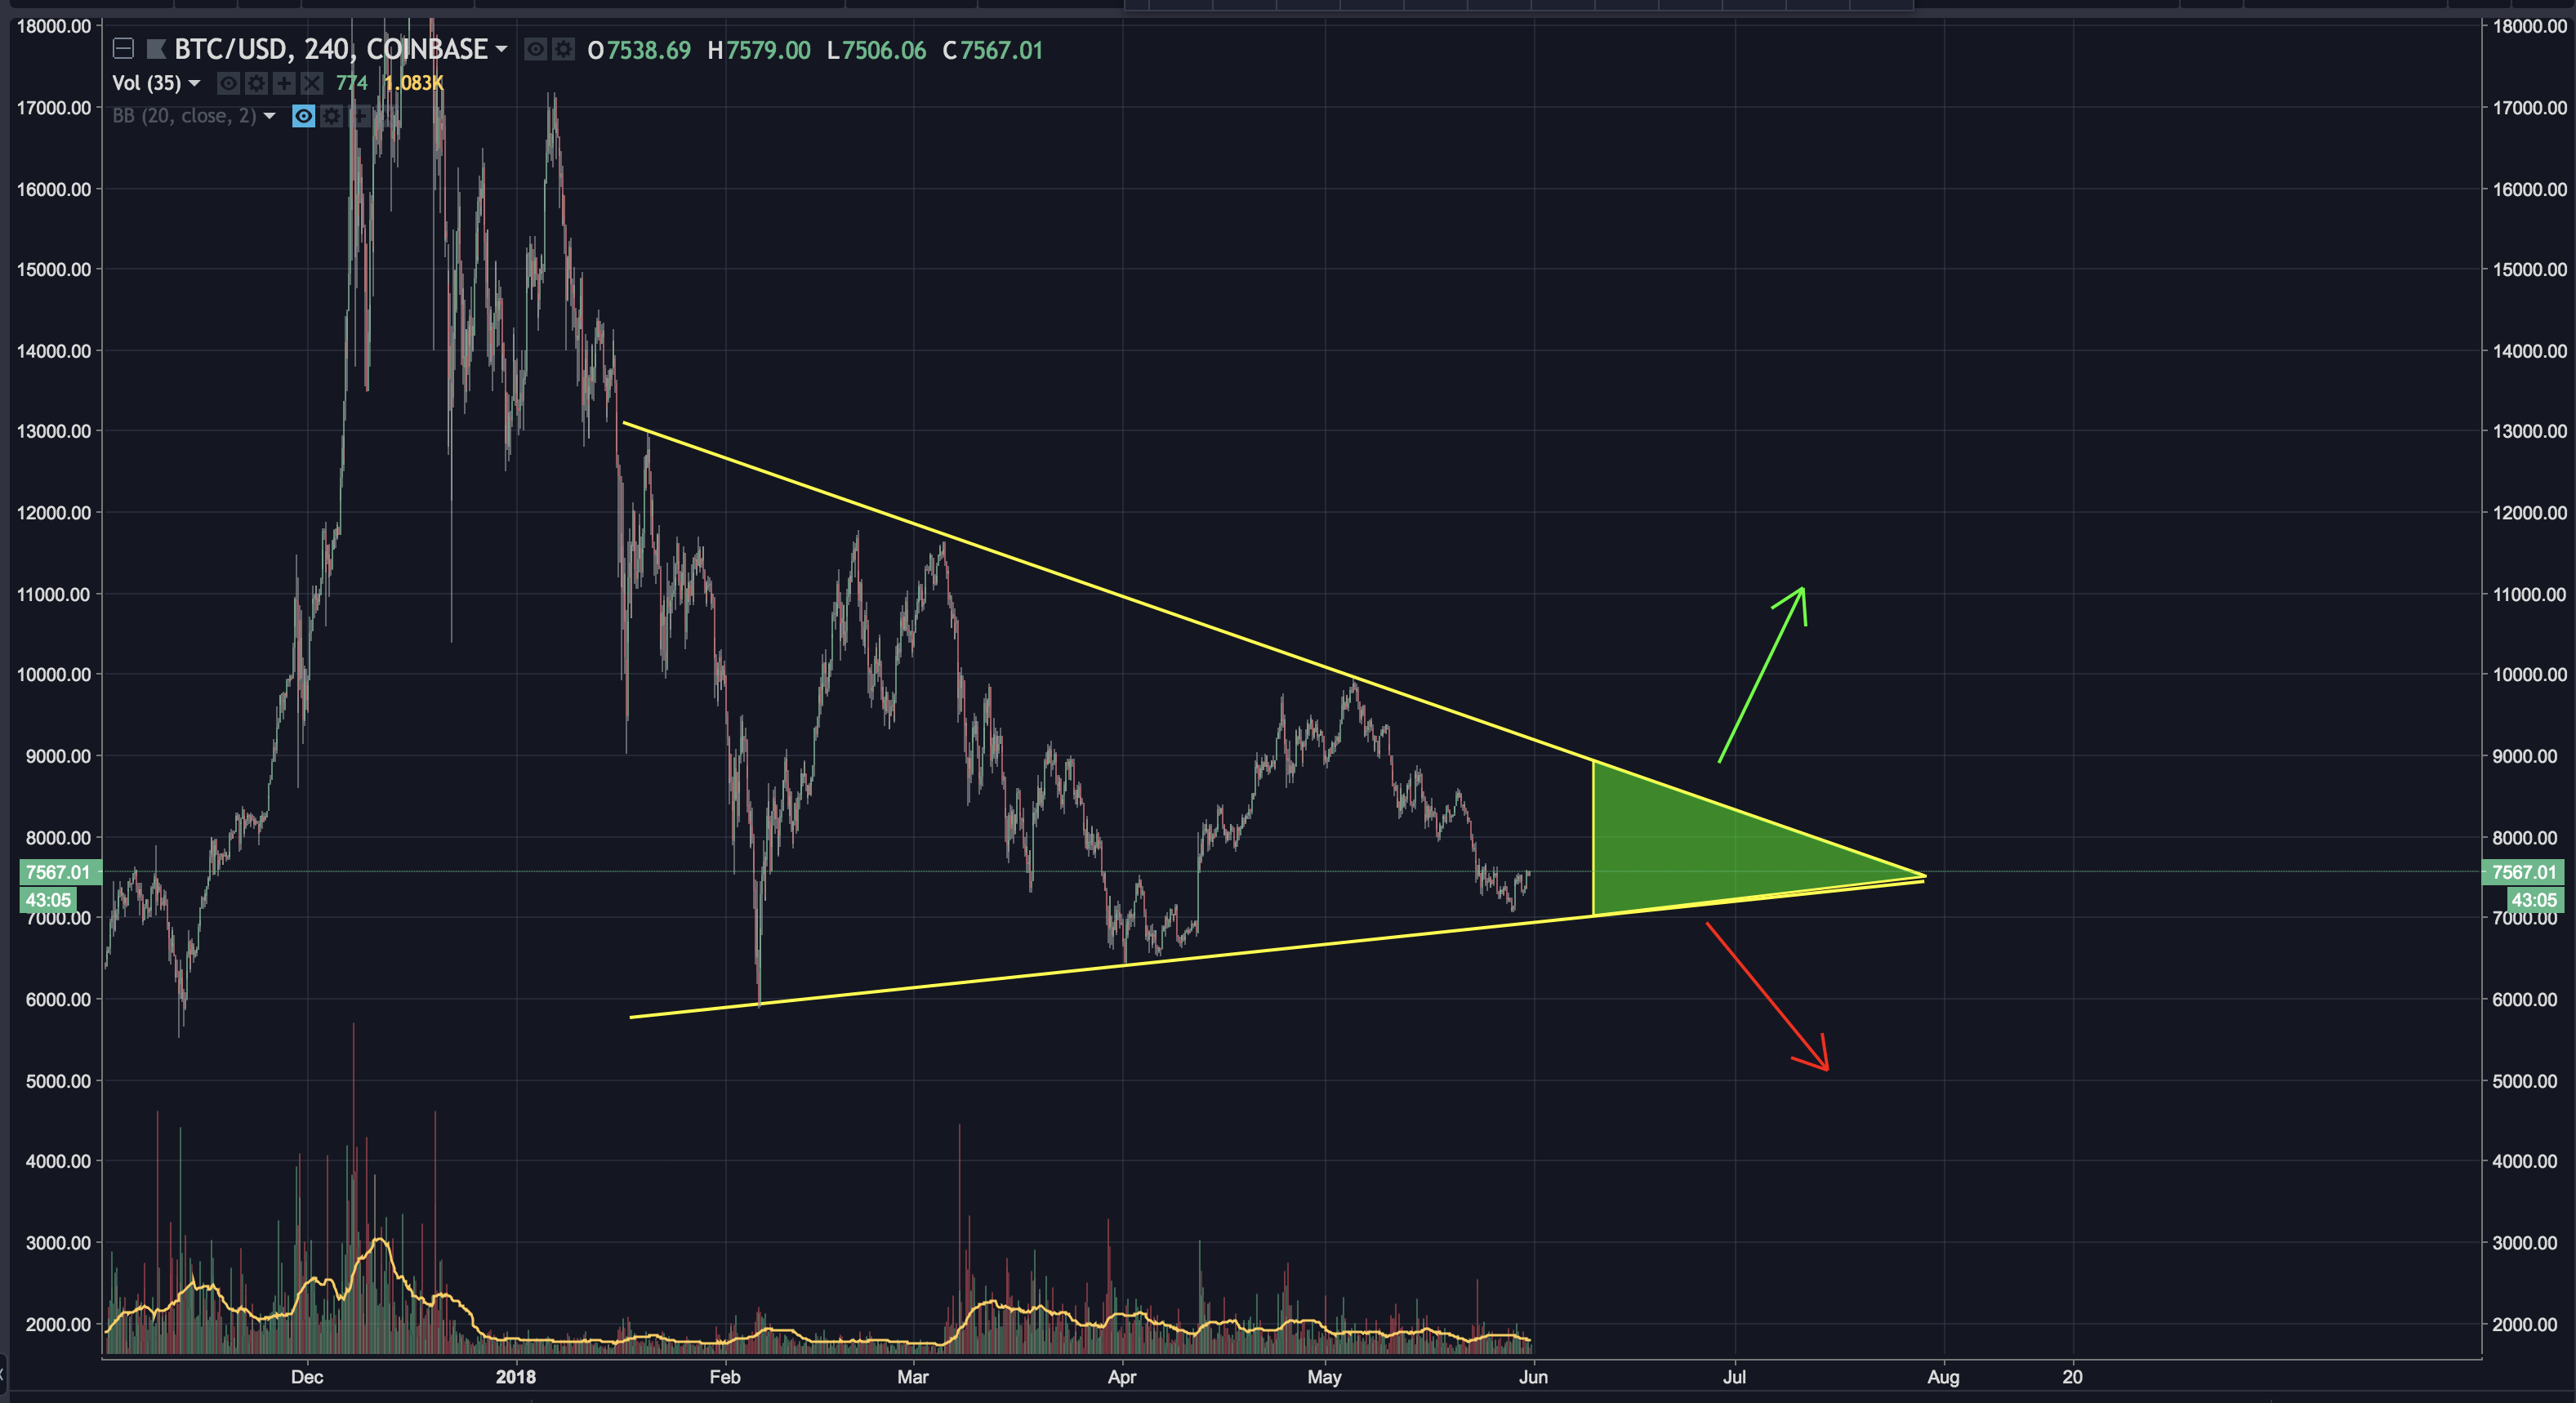
A drop below this wedge may mean a drop to the $5,500-$5,000 area. Conversely, a break above the wedge would be a very bullish indication, and may usher in the 2018 bull run we've all been waiting for!
**BIAS:**
Short Term: Neutral
Longterm: Very Bullish
**I hope this has been helpful. I’d be happy to answer any questions in the comment section below. Thanks for stopping by.**
## **If you found this post informative, please:**

*Disclaimer: I am NOT a financial advisor and this is NOT financial advice. Please always do your own research and invest responsibly. Technical analysis is simply a guide. It doesn’t predict the future. Anyone that claims they know exactly what’s going to happen is foolish, lying or both. Technical Analysis should only be used as a tool to help make better decisions. If you enter a trade, I recommend having a stop loss and sticking to it. You will loose at times. The key is to have more wins than losses. With that in mind, I wish you great success.*

**If you don’t have an account on Binance, I STRONGLY recommend getting one. They’re usually the first to get reputable coins, have excellent security and second to none customer service. You can sign up here free of charge: https://www.binance.com/?ref=16878853**
**FYI…I just started a twitter page where I’ll post analysis, along with other relevant crypto data from myself and others. If you’d like to be notified as soon as updates reach Steemit, the twitter handle is @Workin2005**