Hey Steemians,
today I want to share a TA (technical analysis) with you.
STEEM/BTC in its 4 hours chart is forming a [symmetric triangle](https://school.stockcharts.com/doku.php?id=chart_analysis:chart_patterns:symmetrical_triangle_continuation) which is very likely for a breakout! So it very likely **will** breakout - but it's hard to find out a safe way to tell if up or down. So we have to keep an eye on a few indcators.
## Some facts 4H time frame:
* MACD is showing a bullish signal line
* We see a *short term resistance area around 0,00001705 - 0,00001722 BTC (red box)* - near the weekly pivot (P-W)
* And we see a *short term support area around 0,00001575 - 0,00001590 BTC (green box)*
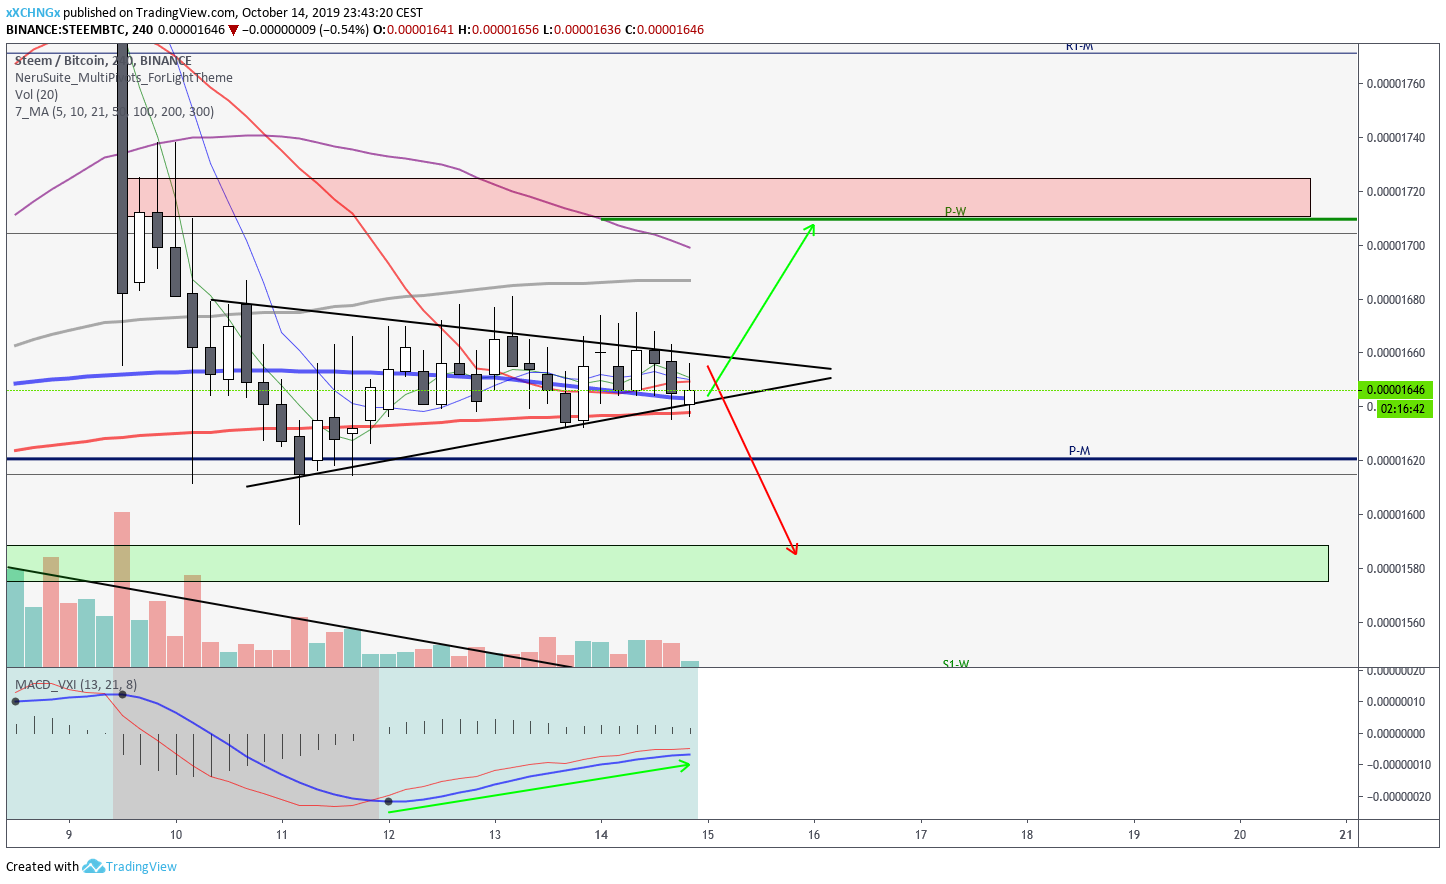
**High Resolution:** https://www.tradingview.com/x/NWBzzIEg/
## Some facts 1D time frame:
* MACD is showing a neutral - bearish signal line
* We see a *mid term support around 0,00001440 - 0,00001470 BTC* (green box) - near the begin of the fibonacci retracement (scale on the left) and the first monthly pivot support (S1-M)
* We see a mid term resistance around *0,00001817 - 0,00001883 BTC (red box)* - near the 0.618 fibonacci level (scale on the left) - **if** it breaks out of this, **target would be 0,00001950 BTC**)
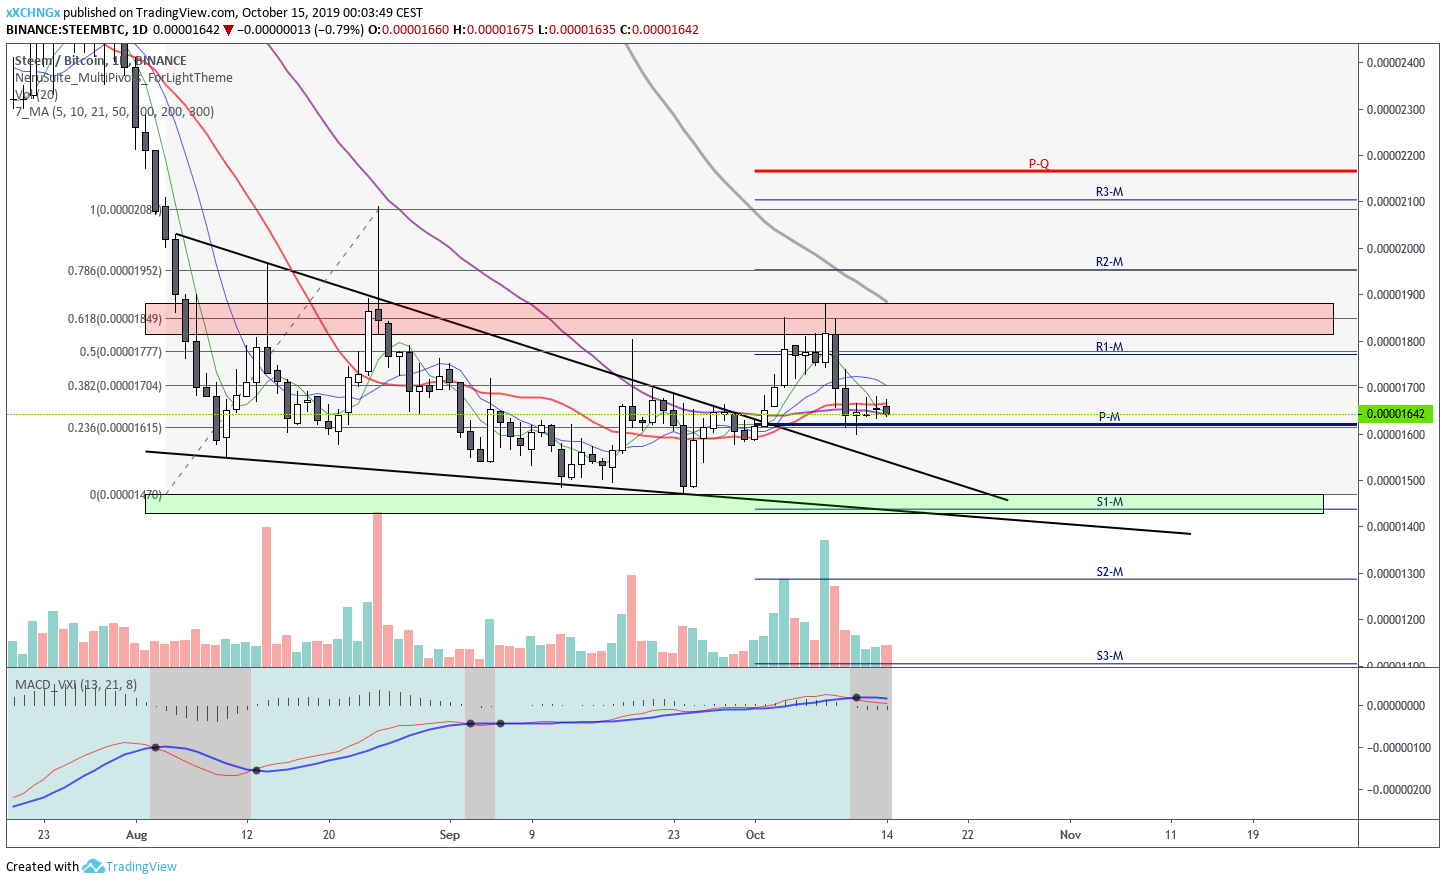
**High Resolution:** https://www.tradingview.com/x/e4V0P5zX/
### Please find out for yourself what is more likely to happen. ALWAYS #DYOR !
## I hope I was able to give you some insights anyways!
# Have a nice day!