create account

Power BI - Data Visualization Tool - Date Heiarchy - Solution by yukon

View this thread on: hive.blogpeakd.comecency.com
· @yukon ·
Power BI - Data Visualization Tool - Date Heiarchy - Solution
So I’ve been using PowerBi quite a bit lately to build visualization tools, and I’ve noticed while the Drill Down Feature is very helpful, the date hierarchies by default do not always work the way I think they should.

**A Quick Example**

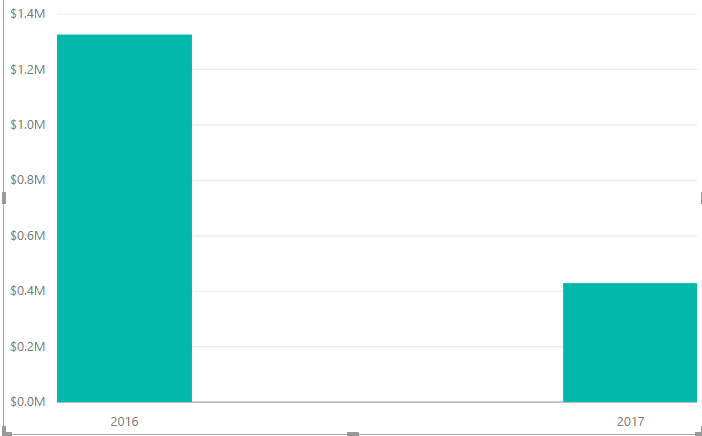
Basic Column Chart with two Years Displayed
![](https://steemitimages.com/DQmR3YbDRcqBEzU3nbR32Wy2Jh64e3qXBdVkbP2ssfxjryo/yearlydrilldown.png)

**Drilling Into a Year**

![](https://steemitimages.com/DQmReMUCG7iQSZhr5qaJPs8w7NLUhX8XZBx9ahkYP2Yzib5/drillintoyear.png)

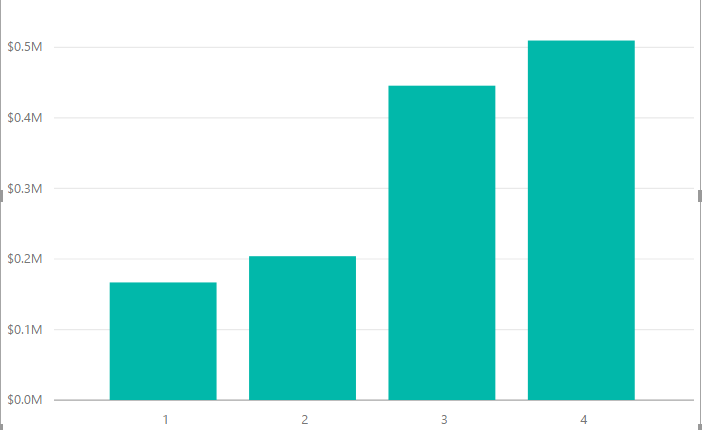
As you can see, we get the 4 columns of 2016, with a very small Q1, rising through until Q4 is by far the largest value.

This works exactly as I would expect it to, however when I expand down a level my results don’t show as I would expect.

![](https://steemitimages.com/DQme2oRbzDktwZVAdXNbY3PcgYTwJthVZ2SoDaWa55X5Ly5/expanddown.png)

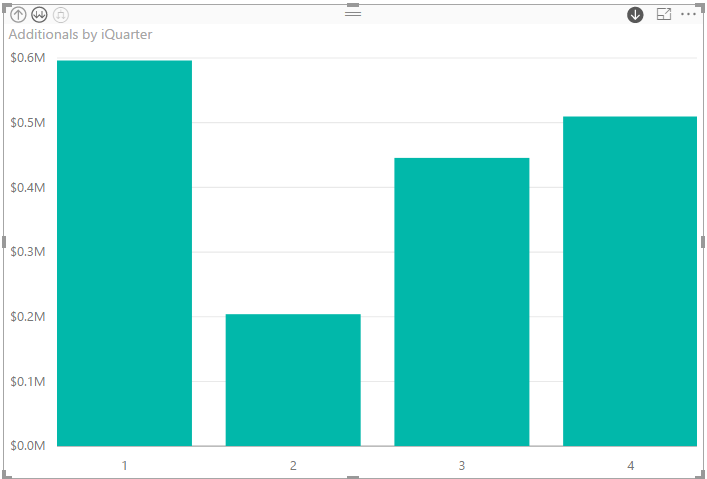
As you can see when I just expand down a level, the data displays 4 quarters again. This time, however, the Q1 number outpaces the Q4 number by a fairly substantial margin. Why is this?

Well the native grouping sees the values of Q1 across multiple years as being part of the same category. Yikes! That’s probably not what you really want to show. You probably need to show Q1 – 2016, Q2 – 2016 etc.

**So how to do that?**

First I took my Date Table and created a second table using the “Reference” ability in Power BI. From there I grouped everything down by Year & Quarter. 

![](https://steemitimages.com/DQmZ6WaEsALZbxYKB33o8dbpuN4GAPTEVTWbt4ypHSk5KTB/quarteryeargrouping.png)

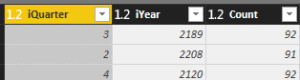
Next I added a column that included a string representation of the Quarter and Year.

Once I have my quarter and year table completed, I returned to my visual, where instead of using the normal date hierarchy I added the Quarterly drill down. I proceeded to do the same thing with the Month and Year until the Drill downs performed the way they were expected to behave (There were some sorting challenges, but on the whole each level was the same as the previous in terms of steps).

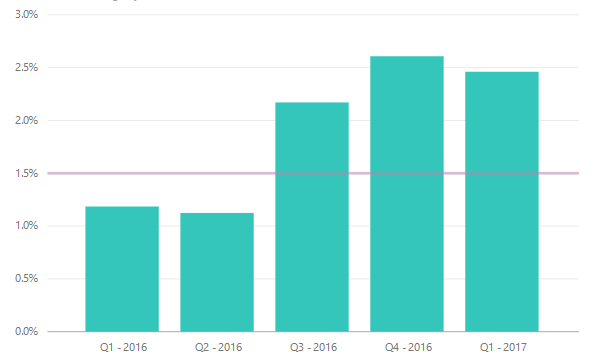
Here’s the final chart, with the drill through expanded to the Quarters to show what the result looked like.
![](https://steemitimages.com/DQmXVsx3zRVJ93cNdZWud7P9Za6Zeg8JmdobEwdqVNa58eB/capture.png)
👍  , ,
properties (23)
authoryukon
permlinkpower-bi-data-visualization-tool-date-heiarchy-solution
categoryblog
json_metadata{"tags":["blog","technology"],"image":["https://steemitimages.com/DQmR3YbDRcqBEzU3nbR32Wy2Jh64e3qXBdVkbP2ssfxjryo/yearlydrilldown.png","https://steemitimages.com/DQmReMUCG7iQSZhr5qaJPs8w7NLUhX8XZBx9ahkYP2Yzib5/drillintoyear.png","https://steemitimages.com/DQme2oRbzDktwZVAdXNbY3PcgYTwJthVZ2SoDaWa55X5Ly5/expanddown.png","https://steemitimages.com/DQmZ6WaEsALZbxYKB33o8dbpuN4GAPTEVTWbt4ypHSk5KTB/quarteryeargrouping.png","https://steemitimages.com/DQmXVsx3zRVJ93cNdZWud7P9Za6Zeg8JmdobEwdqVNa58eB/capture.png"],"app":"steemit/0.1","format":"markdown"}
created2017-05-16 17:22:03
last_update2017-05-16 17:22:03
depth0
children0
last_payout2017-05-23 17:22:03
cashout_time1969-12-31 23:59:59
total_payout_value0.000 HBD
curator_payout_value0.000 HBD
pending_payout_value0.000 HBD
promoted0.000 HBD
body_length2,215
author_reputation31,286,113,964
root_title"Power BI - Data Visualization Tool - Date Heiarchy - Solution"
beneficiaries[]
max_accepted_payout1,000,000.000 HBD
percent_hbd10,000
post_id3,466,055
net_rshares4,280,202,566
author_curate_reward""
vote details (3)