<center></center> Many traders make all of their trading decisions on one single time frame, but many traders aren’t aware of the larger trend. I use multiple time frame (MTF) analysis to improve my discretionary trading decisions. MTF analysis involves analyzing the same asset on multiple time frames. The standard number of time frames (or tick charts or volume charts or range charts, etc) is three. If you use two charts, you may not get the full picture and you use more than three, you might be duplicating efforts. In most of my posts, you will mostly see monthly, weekly, daily and sometimes 4 hr levels zones on my chart because my personality is best suited as a swing trader. But even as a swing trader, these time frames may not work best for another swing trader. The rule of thumb when using MFT is you want your charts to scale down/up by 4X – 6X. Below are some common used time frames when using MTF. I tend to use these time frames combinations: 1. Swing trading: weekly, daily, 4 hour charts. 2. Intra-day/week trading: daily, 4 hour, 1 hour charts. 3. Intra-day trading: daily, 1 hour, 15 minute charts. NOTE: Scalpers could perhaps go with a 4 hr or 1 hour, 15 minute and 5 minute chart combination. Thus, a trader who holds positions for weeks or months won’t use a 15-minute, 60-minute and 4 hr MTF analysis. At the same time, a day trader who holds positions for hours or even minutes won’t use a daily, weekly and monthly MTF analysis. <center>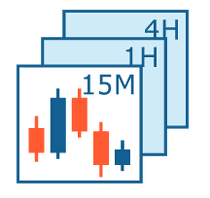</center> **<center>Highest Time Frame</center>** I use the highest time frame for curve analysis. Where did price stop going lower and turned higher and/or where did price stop going higher and turned lower. If the price is in the middle of zone, then I will move to a lower time frame to identify the trend. NOTE: trend can be rather complicated to explain, so I will create a post strictly on trend in the future. **<center>Middle Time Frame</center>** I use the middle time frame for determining trend: continuation of trend, consolidation, whether price is ranging and potential reversals. I’m a trend trader and prefer trading asset that is trending up or down. ’m looking to get in the trend on pull backs. **<center>Lower Time Frame</center>** Depending on the size of the zone and my risk, I make entry trades directly on the zones identify on the middle time frame. However, if I want to lower my risk or fine tune my entries, I will use the lower time frame. **<center>Multiple Time Frame Example - Abercrombie & Fitch Company </center>** Monthly Chart (Curve) - price is high on the curve. 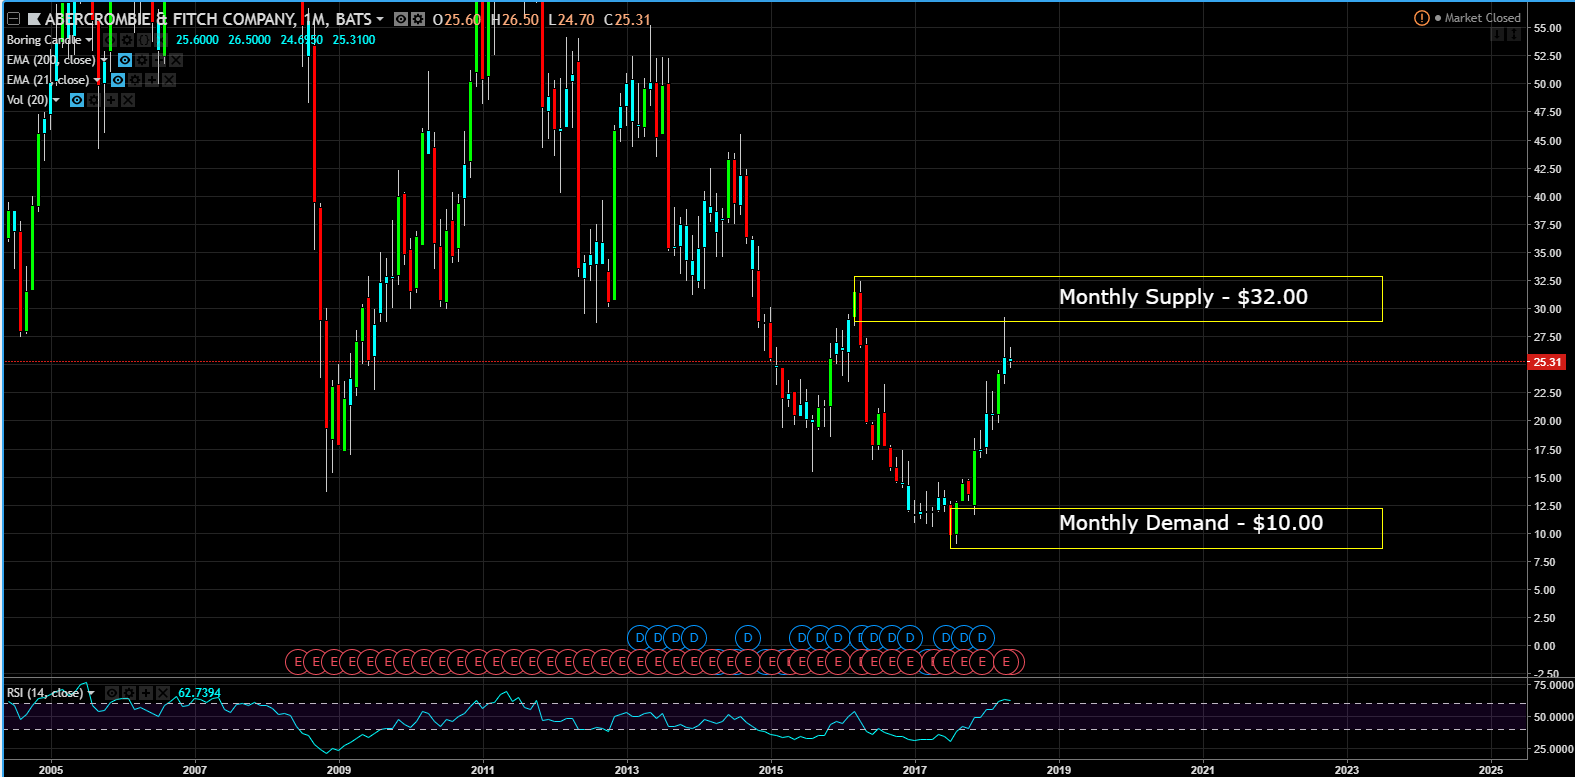 Weekly Chart (Trend) - the trend is up. 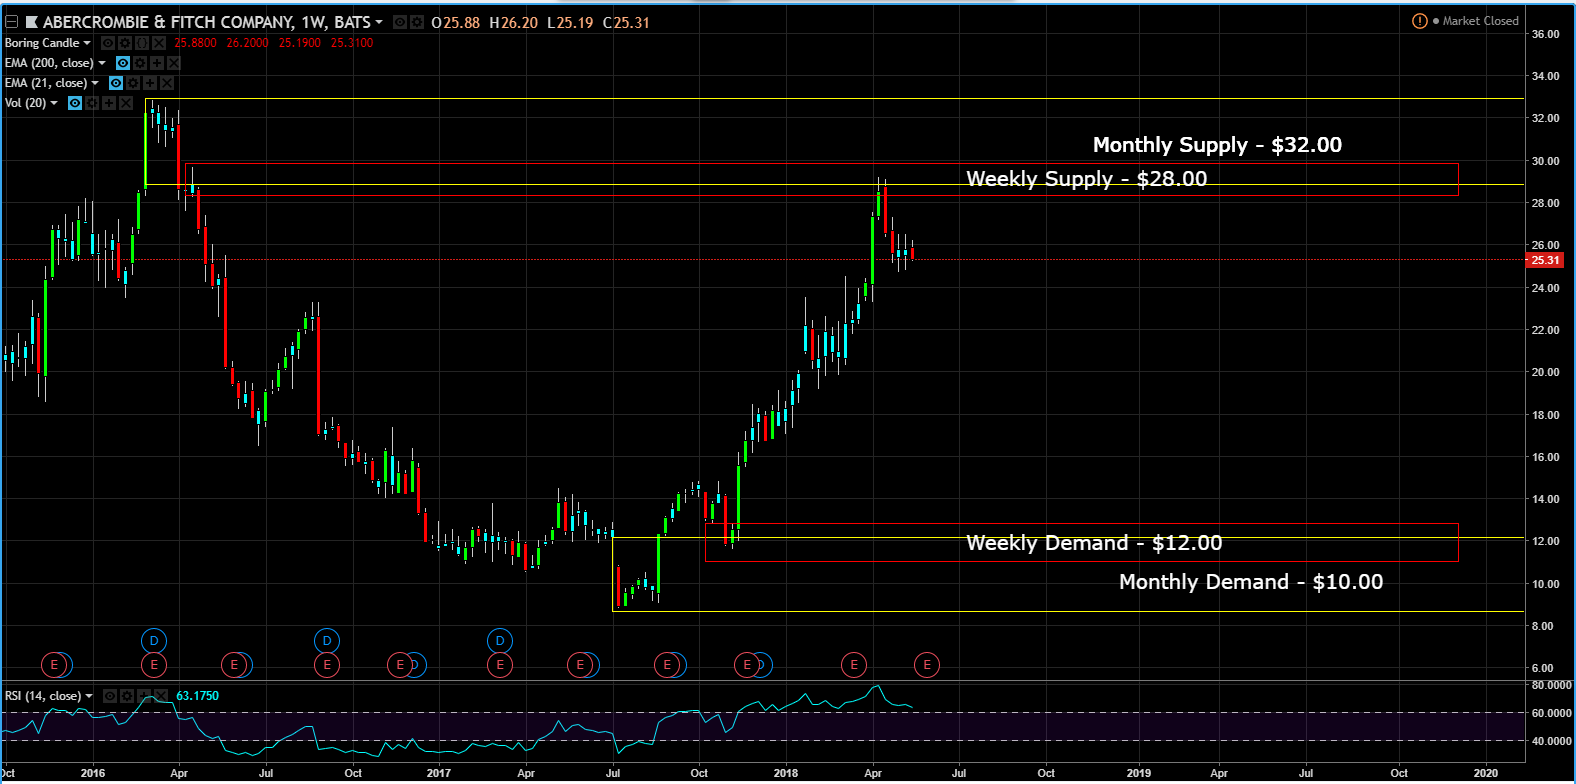 Daily Chart (Entry) - buy entry is at $22.50. 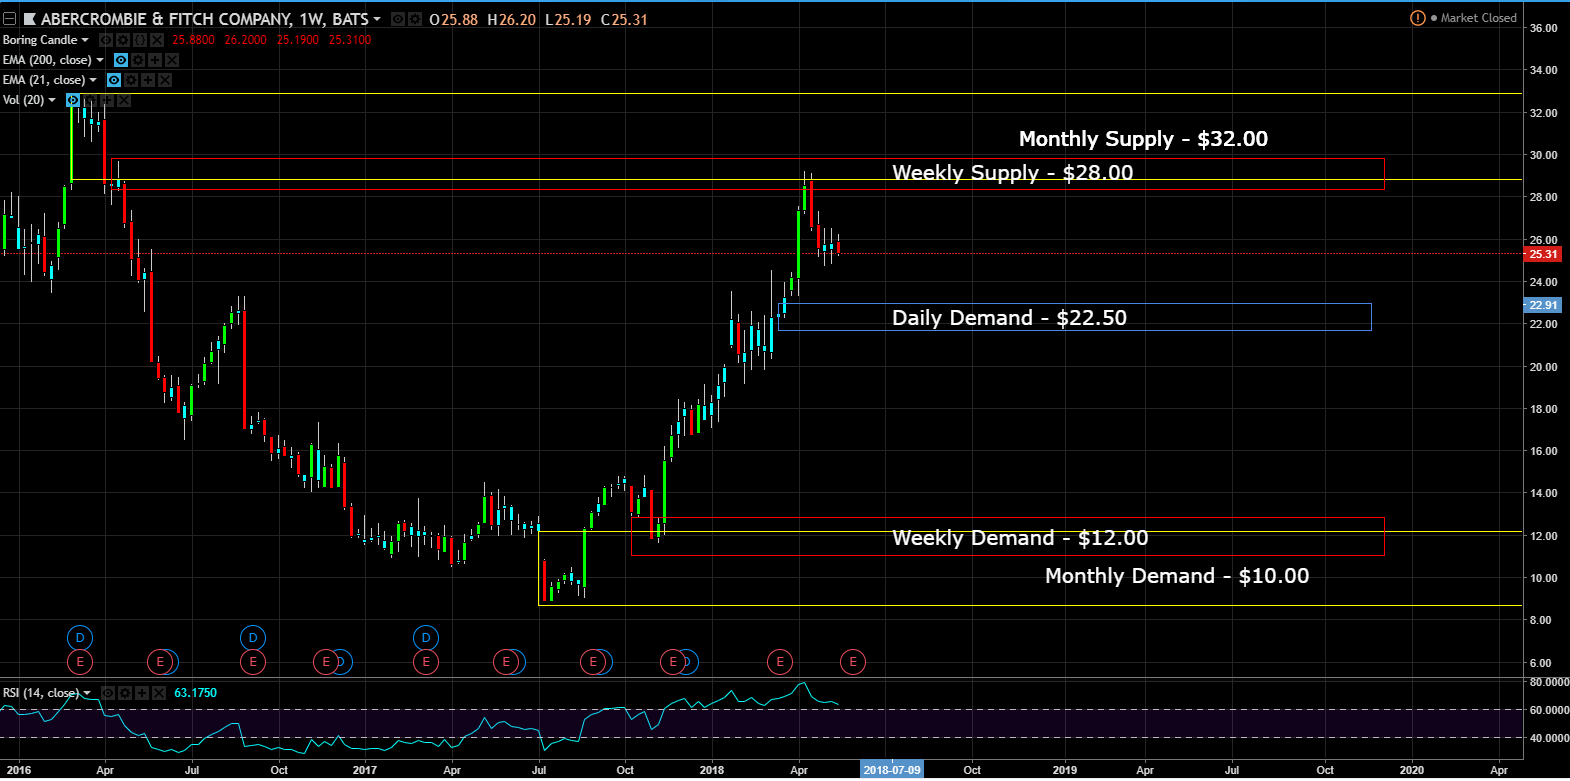 However, the monthly and weekly supply zones trumps daily demand zones high on the curve, so I wouldn't take this trade if price returned to the $22.50 level. I would wait for price action to do the following: * Price breaks the monthly and weekly supply zone, buy long on a pull back (orange arrows). * Price breaks the daily demand zone, short on a pull back with a target at $12.00 (aqua arrows). 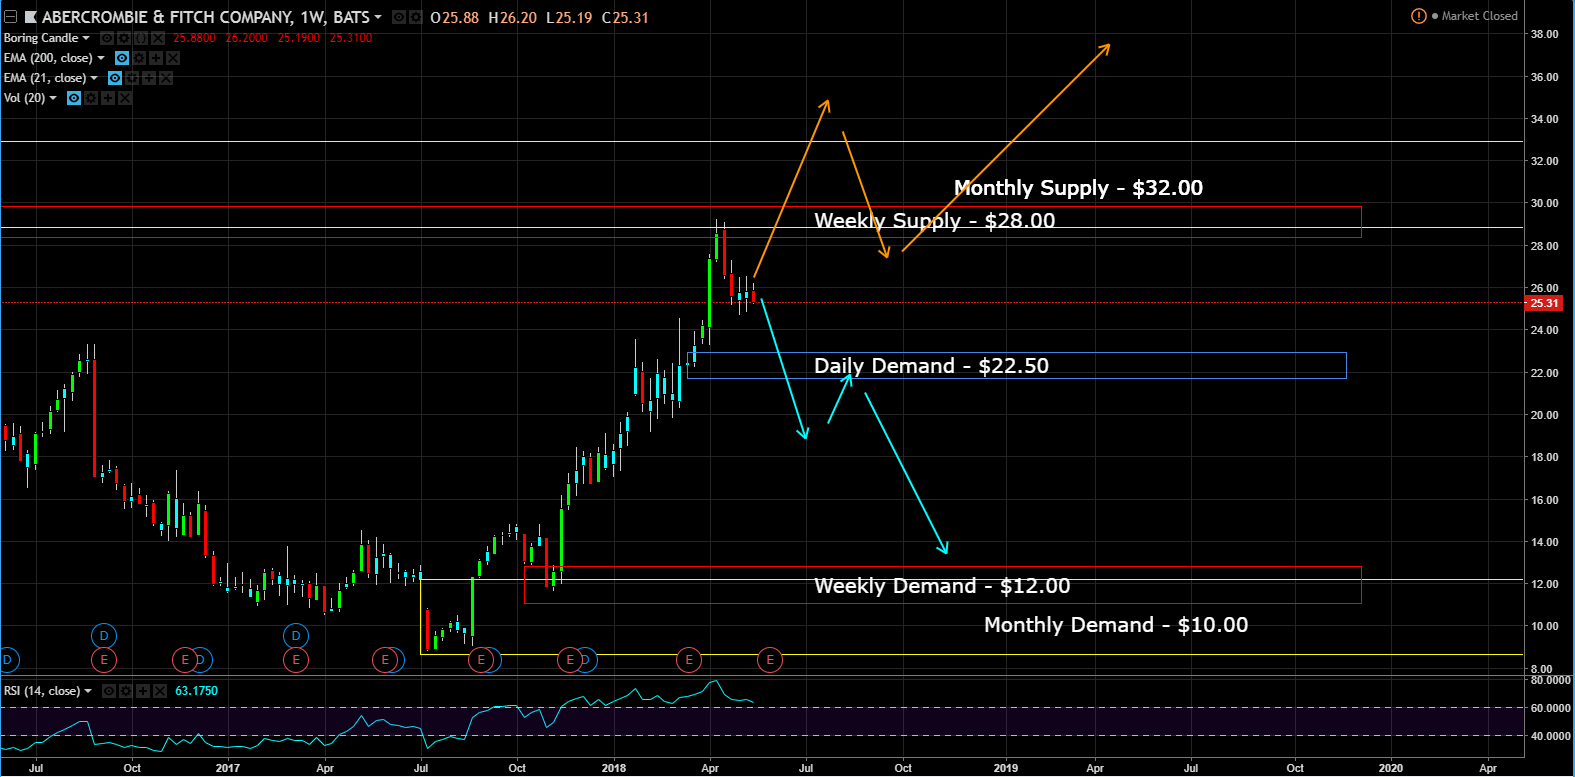 When all three time frames are combined with a trader’s strategy, his/her success rate will increase. When I analyzing an asset with a top-down approach, it ensures I get into trades in the direction of the larger trend. When I trade in the direction of the larger trend, I instantly lower my risk. Unfortunately, many traders ignore MFT analysis, but it’s the easiest way to get in and enjoy the larger trend. 
| author | rollandthomas |
|---|---|
| permlink | multiple-trading-time-frame-analysis |
| category | market |
| json_metadata | {"tags":["market","trading","investing","money","investorsclub"],"image":["https://steemitimages.com/DQmenJ3CGoykRakxkKiqpTBDxbiZRSxCeFpyESTvsZJKRMH/image.png","https://steemitimages.com/DQmVVdJqbSqdZ9H1kiQb5MHsoTzWDNLE8p6WYYGVM4kBbwW/image.png","https://steemitimages.com/DQmWveQWHzDTNJ4YTxXarCcXsgpoV9hd6dhnGh1PVWaDbDw/image.png","https://steemitimages.com/DQmd41N5pQgGDgBSusTrPtHYAvjwZNWb2LWqF7jPDQGYiZz/image.png","https://steemitimages.com/DQmea4i76RjZe66F5Hsbc74771toN9eBosFcPd4pZjaQuE7/image.png","https://steemitimages.com/DQmWiSkFPZo29ZX4kwiN4MFC91eqzzarpCN6GqzHJzDkni3/image.png","https://steemitimages.com/DQmRhDtjokAZnGKi4QwheqksKTFo6m4fsjMYsNNrsitC1xk/upvote%20banner3.gif"],"app":"steemit/0.1","format":"markdown"} |
| created | 2018-05-15 12:43:21 |
| last_update | 2018-05-15 12:43:21 |
| depth | 0 |
| children | 6 |
| last_payout | 2018-05-22 12:43:21 |
| cashout_time | 1969-12-31 23:59:59 |
| total_payout_value | 4.290 HBD |
| curator_payout_value | 0.794 HBD |
| pending_payout_value | 0.000 HBD |
| promoted | 0.000 HBD |
| body_length | 4,177 |
| author_reputation | 486,267,436,549,811 |
| root_title | "Multiple Trading Time Frame Analysis" |
| beneficiaries | [] |
| max_accepted_payout | 1,000,000.000 HBD |
| percent_hbd | 10,000 |
| post_id | 55,818,157 |
| net_rshares | 1,025,049,774,980 |
| author_curate_reward | "" |
| voter | weight | wgt% | rshares | pct | time |
|---|---|---|---|---|---|
| yuliana | 0 | 6,582,037,233 | 100% | ||
| worldclassplayer | 0 | 14,809,335,877 | 7% | ||
| viqral | 0 | 6,548,026,904 | 100% | ||
| leanvix | 0 | 6,699,299,677 | 100% | ||
| kevindixon | 0 | 1,221,331,654 | 100% | ||
| mynaturebody | 0 | 12,491,760,784 | 100% | ||
| roshan77 | 0 | 6,559,182,977 | 100% | ||
| milagros | 0 | 6,931,747,794 | 100% | ||
| tatyanamishenko | 0 | 6,555,871,818 | 100% | ||
| ccoin | 0 | 6,245,710,325 | 100% | ||
| chillinph | 0 | 7,055,543,660 | 100% | ||
| musicfromsoul | 0 | 6,741,687,627 | 100% | ||
| tazbaz | 0 | 6,448,138,636 | 100% | ||
| sagorahmed | 0 | 6,589,380,497 | 100% | ||
| gazbaz4000 | 0 | 1,297,446,519 | 50% | ||
| fplacido | 0 | 7,075,880,684 | 100% | ||
| concession | 0 | 6,525,395,990 | 100% | ||
| newageinv | 0 | 22,775,093,714 | 50% | ||
| rahulsingh25843 | 0 | 6,779,489,190 | 100% | ||
| andrius1 | 0 | 611,102,186 | 100% | ||
| leeyh | 0 | 10,465,939,440 | 100% | ||
| rollandthomas | 0 | 3,621,170,527 | 100% | ||
| tradergurl | 0 | 506,700,902 | 100% | ||
| estabond | 0 | 393,266,814,650 | 10.21% | ||
| djfugly | 0 | 6,681,167,347 | 100% | ||
| whalecreator | 0 | 236,380,851,042 | 40.54% | ||
| xmrking | 0 | 1,015,584,628 | 100% | ||
| investorsclub | 0 | 44,270,885,829 | 100% | ||
| peoplesbot | 0 | 182,297,196,869 | 100% |
Upvoted ($0.22) and resteemed by @investorsclub

[Join the Investors Club](https://steemit.com/money/@investorsclub/welcome-to-the-investors-club-week-1-highlights) if you are interested in investing.
| author | investorsclub |
|---|---|
| permlink | re-rollandthomas-multiple-trading-time-frame-analysis-20180515t204206270z |
| category | market |
| json_metadata | {"tags":["market"],"users":["investorsclub"],"links":["https://steemit.com/money/@investorsclub/welcome-to-the-investors-club-week-1-highlights"],"app":"steemit/0.1"} |
| created | 2018-05-15 20:42:09 |
| last_update | 2018-05-15 20:42:09 |
| depth | 1 |
| children | 0 |
| last_payout | 2018-05-22 20:42:09 |
| cashout_time | 1969-12-31 23:59:59 |
| total_payout_value | 0.039 HBD |
| curator_payout_value | 0.000 HBD |
| pending_payout_value | 0.000 HBD |
| promoted | 0.000 HBD |
| body_length | 200 |
| author_reputation | 8,441,755,130,312 |
| root_title | "Multiple Trading Time Frame Analysis" |
| beneficiaries | [] |
| max_accepted_payout | 1,000,000.000 HBD |
| percent_hbd | 10,000 |
| post_id | 55,887,875 |
| net_rshares | 8,576,035,474 |
| author_curate_reward | "" |
| voter | weight | wgt% | rshares | pct | time |
|---|---|---|---|---|---|
| ozphil | 0 | 0 | 100% | ||
| investorsclub | 0 | 8,576,035,474 | 20% |
Great insight on looking at different perspectives as they all have influence on the price action. Even long term investors will benefit to determine entry points. Thanks!
| author | newageinv |
|---|---|
| permlink | re-rollandthomas-multiple-trading-time-frame-analysis-20180515t161445943z |
| category | market |
| json_metadata | {"tags":["market"],"app":"steemit/0.1"} |
| created | 2018-05-15 16:14:45 |
| last_update | 2018-05-15 16:14:45 |
| depth | 1 |
| children | 0 |
| last_payout | 2018-05-22 16:14:45 |
| cashout_time | 1969-12-31 23:59:59 |
| total_payout_value | 0.000 HBD |
| curator_payout_value | 0.000 HBD |
| pending_payout_value | 0.000 HBD |
| promoted | 0.000 HBD |
| body_length | 173 |
| author_reputation | 265,792,238,913,130 |
| root_title | "Multiple Trading Time Frame Analysis" |
| beneficiaries | [] |
| max_accepted_payout | 1,000,000.000 HBD |
| percent_hbd | 10,000 |
| post_id | 55,851,849 |
| net_rshares | 0 |
Sounds quite similar to Alexander Elders triple screen method, ripples on waves on tides.

I tend to just look on the daily chart at the start of the day for direction, then trade on just an hourly chart.

It's just what works for me though. I did try triple time period trading before but found I was missing out on some great opportunities because one of the timeframes wasn't 'right'. Just personal preference though.
| author | tradergurl |
|---|---|
| permlink | re-rollandthomas-multiple-trading-time-frame-analysis-20180515t205929064z |
| category | market |
| json_metadata | {"tags":["market"],"app":"steemit/0.1"} |
| created | 2018-05-15 20:59:27 |
| last_update | 2018-05-15 20:59:27 |
| depth | 1 |
| children | 1 |
| last_payout | 2018-05-22 20:59:27 |
| cashout_time | 1969-12-31 23:59:59 |
| total_payout_value | 0.000 HBD |
| curator_payout_value | 0.000 HBD |
| pending_payout_value | 0.000 HBD |
| promoted | 0.000 HBD |
| body_length | 420 |
| author_reputation | 185,488,636,471 |
| root_title | "Multiple Trading Time Frame Analysis" |
| beneficiaries | [] |
| max_accepted_payout | 1,000,000.000 HBD |
| percent_hbd | 10,000 |
| post_id | 55,889,899 |
| net_rshares | 3,308,229,864 |
| author_curate_reward | "" |
| voter | weight | wgt% | rshares | pct | time |
|---|---|---|---|---|---|
| rollandthomas | 0 | 3,308,229,864 | 100% |
This is exactly the triple screen with a twist. Alexander Elders I believe was given credit for being the first to use MTF / triple screen method.
| author | rollandthomas |
|---|---|
| permlink | re-tradergurl-re-rollandthomas-multiple-trading-time-frame-analysis-20180516t035640309z |
| category | market |
| json_metadata | {"tags":["market"],"app":"steemit/0.1"} |
| created | 2018-05-16 03:56:00 |
| last_update | 2018-05-16 03:56:00 |
| depth | 2 |
| children | 0 |
| last_payout | 2018-05-23 03:56:00 |
| cashout_time | 1969-12-31 23:59:59 |
| total_payout_value | 0.000 HBD |
| curator_payout_value | 0.000 HBD |
| pending_payout_value | 0.000 HBD |
| promoted | 0.000 HBD |
| body_length | 147 |
| author_reputation | 486,267,436,549,811 |
| root_title | "Multiple Trading Time Frame Analysis" |
| beneficiaries | [] |
| max_accepted_payout | 1,000,000.000 HBD |
| percent_hbd | 10,000 |
| post_id | 55,937,399 |
| net_rshares | 506,700,902 |
| author_curate_reward | "" |
| voter | weight | wgt% | rshares | pct | time |
|---|---|---|---|---|---|
| tradergurl | 0 | 506,700,902 | 100% |
You got a 40.54% upvote from @whalecreator courtesy of @rollandthomas! Delegate your Steem Power to earn 100% payouts.
| author | whalecreator |
|---|---|
| permlink | re-rollandthomas-multiple-trading-time-frame-analysis-20180515t131704828z |
| category | market |
| json_metadata | {"app":"postpromoter/1.9.3"} |
| created | 2018-05-15 13:17:06 |
| last_update | 2018-05-15 13:17:06 |
| depth | 1 |
| children | 0 |
| last_payout | 2018-05-22 13:17:06 |
| cashout_time | 1969-12-31 23:59:59 |
| total_payout_value | 0.000 HBD |
| curator_payout_value | 0.000 HBD |
| pending_payout_value | 0.000 HBD |
| promoted | 0.000 HBD |
| body_length | 119 |
| author_reputation | -582,393,550,059 |
| root_title | "Multiple Trading Time Frame Analysis" |
| beneficiaries | [] |
| max_accepted_payout | 1,000,000.000 HBD |
| percent_hbd | 10,000 |
| post_id | 55,822,977 |
| net_rshares | 0 |
excellent..apprec. your support..You are on my auto upvote shortly!
| author | yankee-statman |
|---|---|
| permlink | re-rollandthomas-multiple-trading-time-frame-analysis-20180515t155738548z |
| category | market |
| json_metadata | {"tags":["market"],"app":"steemit/0.1"} |
| created | 2018-05-15 15:57:36 |
| last_update | 2018-05-15 15:57:36 |
| depth | 1 |
| children | 0 |
| last_payout | 2018-05-22 15:57:36 |
| cashout_time | 1969-12-31 23:59:59 |
| total_payout_value | 0.000 HBD |
| curator_payout_value | 0.000 HBD |
| pending_payout_value | 0.000 HBD |
| promoted | 0.000 HBD |
| body_length | 67 |
| author_reputation | 11,527,600,073,486 |
| root_title | "Multiple Trading Time Frame Analysis" |
| beneficiaries | [] |
| max_accepted_payout | 1,000,000.000 HBD |
| percent_hbd | 10,000 |
| post_id | 55,849,087 |
| net_rshares | 0 |