In this post, we take a look at How to Create Pheatmap Chart in R. This chart is often used by the people who are into the analytics and the people who are trying to find out the psychology behind the web page clicks. So this is handy chart.
Previously we looked at how to create the waffle chart. That chart was something a lot of people wanted to do because it was like githubs progress chart. Now here we are going to be trying out one of the variation of the heatmap. So slight change in the heatmap variation there.
Rstudio is the tool I am using for plotting the pheatmap. This would bea good idea for you compared to using the command line of the R terminal for the plots. So use the rstudio if you are planning on making the chart.
I have created a video to give you an overview on How to Create Pheatmap Chart in R. You should give this one a try.
---
https://www.youtube.com/watch?v=cHAOLrVIDVk
---
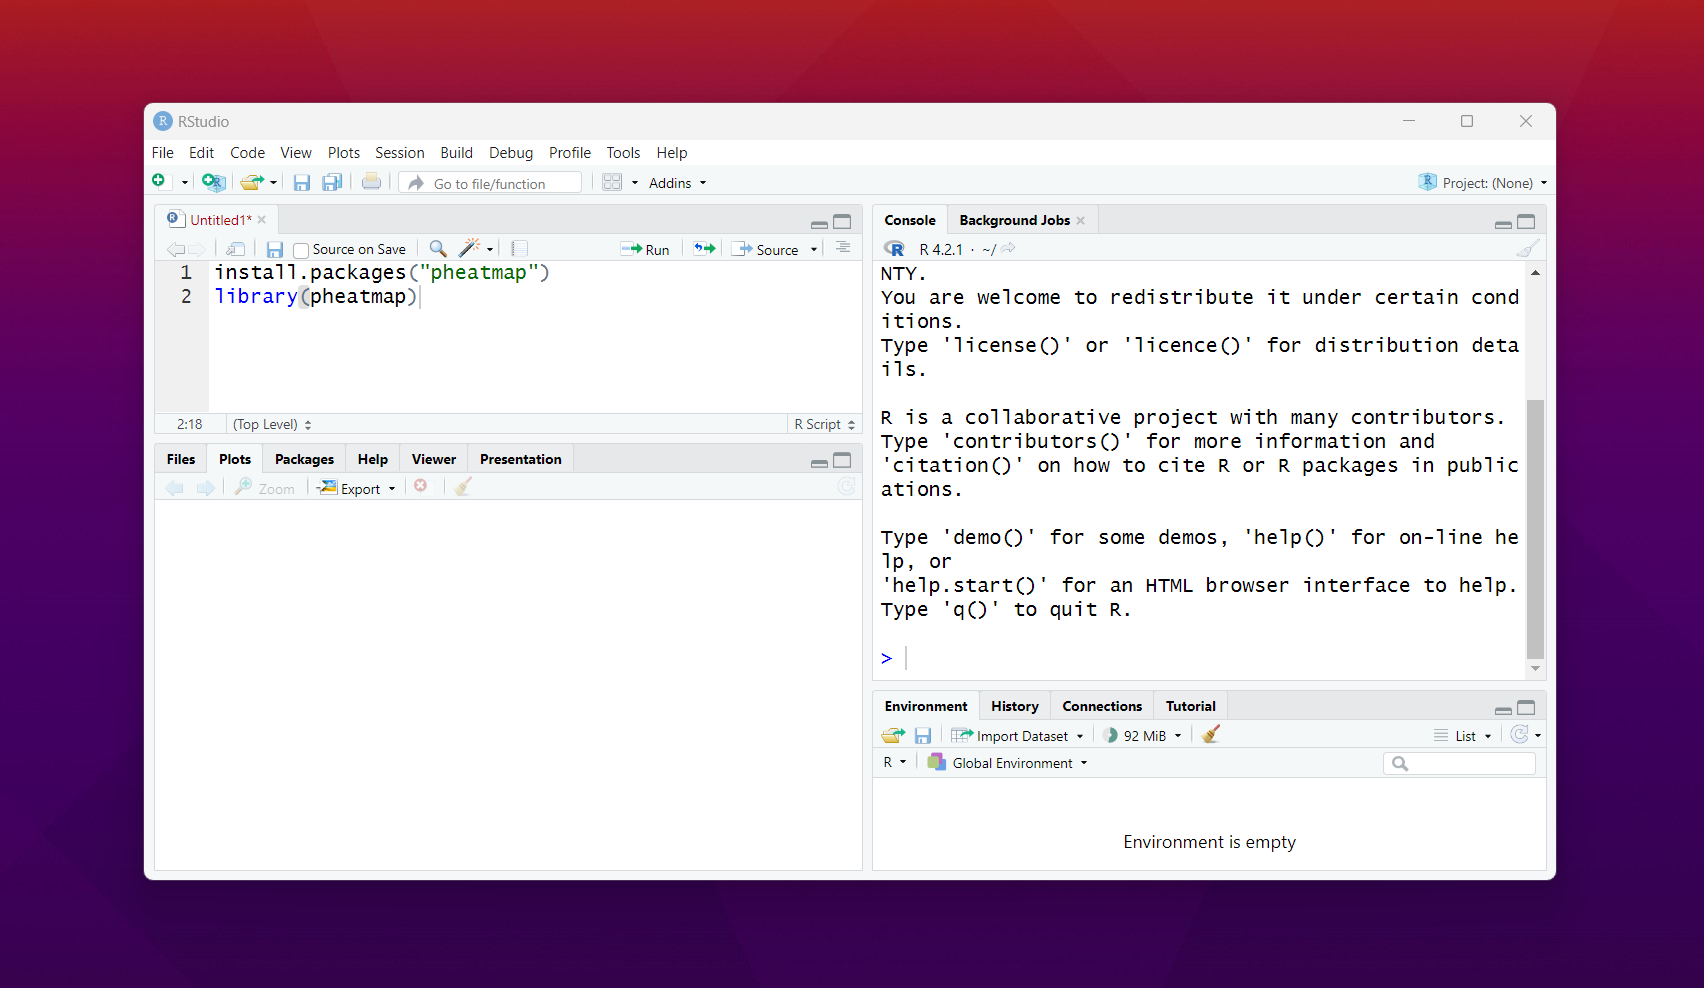
For this library you may want to make use of the pheatmap library. You have to install the package and then make sure to use the package for the calling the libarary.
>install.packages("pheatmap")
library(pheatmap)
You can see the Rstudio after this action like this.
Now once installed you are good to go for making the data for this chart. So let's focus on that part.
>set.seed(8)
m <- matrix(rnorm(200), 10, 10)
colnames(m) <- paste("Col", 1:10)
rownames(m) <- paste("Row", 1:10)
This would be making use of the seed and also the column and row each 1x10. So that would be a good start for you to work with.
Now let's draw the chart using below code.
>pheatmap(m)
Now take a look at the chart output below.
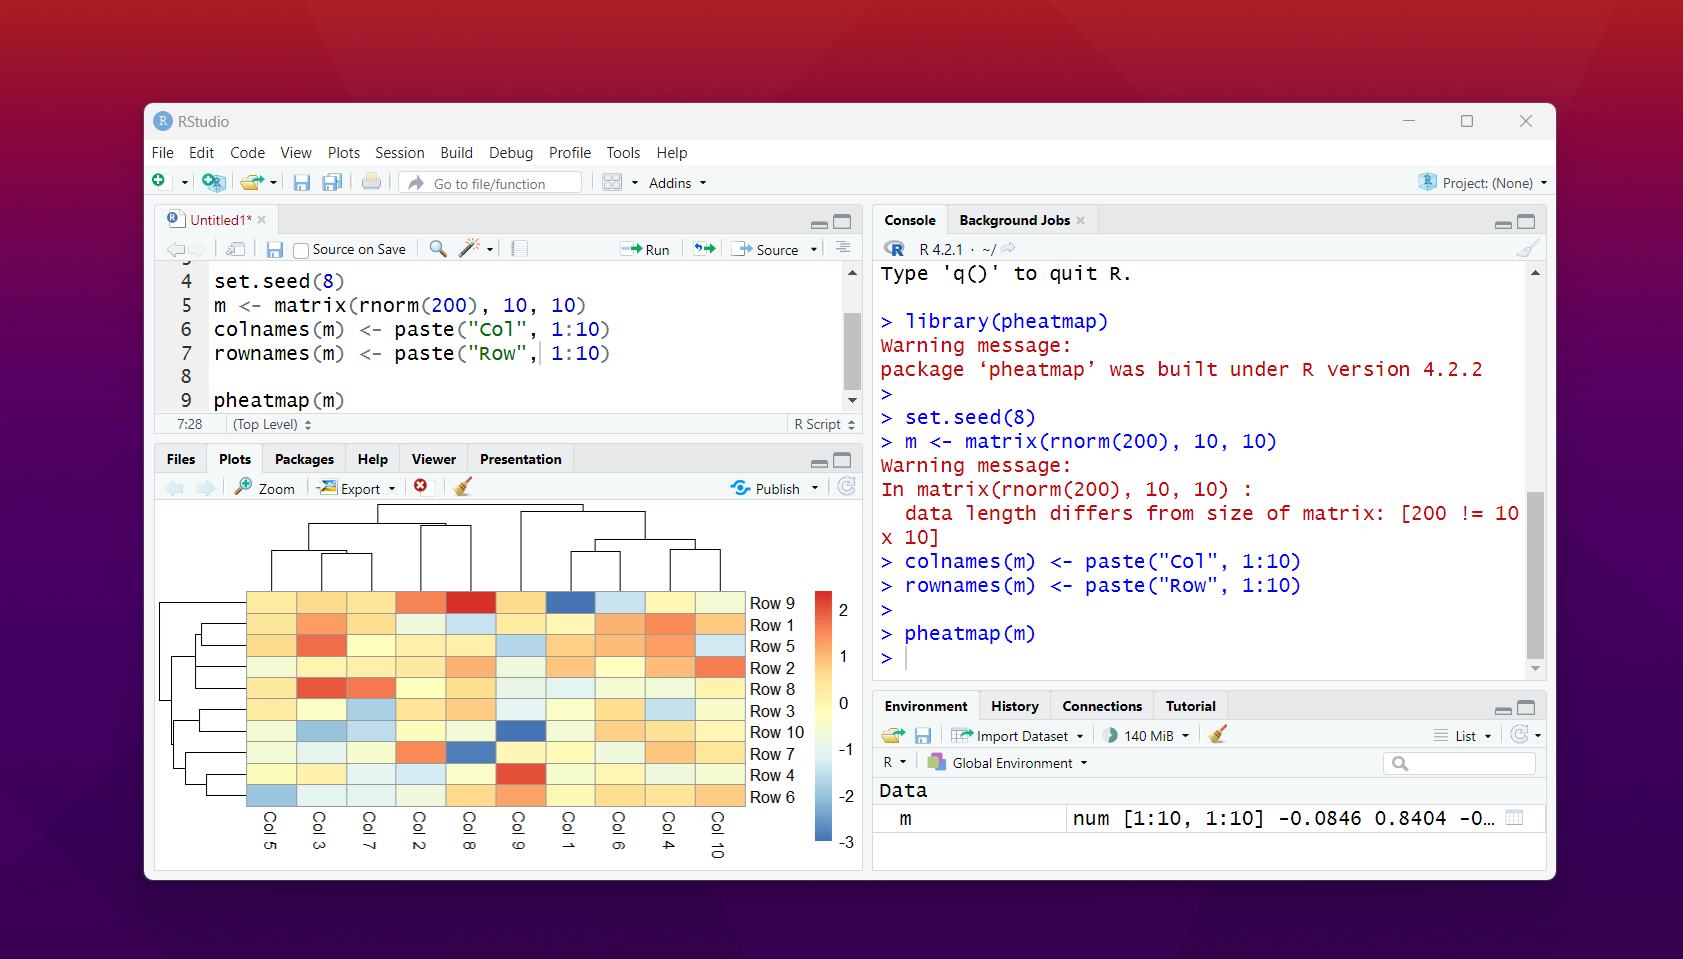
As you can see this is one chart where you would have the dendrogram too. I'd be going in the detail about these in next tutorial. But for now look at the values and also the legend. So you get the gradient color for the legends too.
That's it. You get the idea on how to draw the pheatmap. Now it's time to do more customization and you would be able to get more points and changes. Like even the orientation of the label is something you would make things cool. I'd say you should check out the those custom changes through documentation.
Now I have managed to do some of the changes in the pheatmap with say legend colors etc. I can say you should experiment too. Because it'd be more cool based on your data. You can also find some test data on the kaggle. Like this you have option to plot different variations of this plot.
Once I am done with the datasets and library tutorials, I'd be moving onto the Rstudio tutorials for the cloud too. Because that is something we have not much explored here as well. So that's one of the things that I have plans to explore with the R packages.
Next in the tutorial series are - dendrogram and CalendR plots. So the plots I have few more in the pipeline. I think Power BI cloud and desktop is something I would going ahead with this year because I have some data connectors to cover as well.
If you happen to like this content, do give me feedback over there and that would help me improve my efforts in near future.| author | devpress |
|---|---|
| permlink | r-language-how-to-create-pheatmap-chart-in-r |
| category | hive-122108 |
| json_metadata | {"tags":["stem","neoxian","vyb","programming"],"image":["https://img.youtube.com/vi/cHAOLrVIDVk/0.jpg","https://images.hive.blog/DQmYp9Ciuo3mGezDxS3vuZf8Ku7tgqRh6RiR2rijyGFxsVo/rs.png","https://images.hive.blog/DQmUxihjK1E8avnbUxE6aZyme1EbwSFU52fejVByVRkLZrN/ph.png"],"links":["https://www.youtube.com/watch?v=cHAOLrVIDVk"],"app":"hiveblog/0.1","format":"markdown"} |
| created | 2023-02-25 10:10:06 |
| last_update | 2023-02-25 10:10:06 |
| depth | 0 |
| children | 4 |
| last_payout | 2023-03-04 10:10:06 |
| cashout_time | 1969-12-31 23:59:59 |
| total_payout_value | 2.186 HBD |
| curator_payout_value | 2.146 HBD |
| pending_payout_value | 0.000 HBD |
| promoted | 0.000 HBD |
| body_length | 3,304 |
| author_reputation | 55,061,325,071,240 |
| root_title | "R Language - How to Create Pheatmap Chart in R" |
| beneficiaries | [] |
| max_accepted_payout | 1,000,000.000 HBD |
| percent_hbd | 10,000 |
| post_id | 121,106,399 |
| net_rshares | 7,700,808,183,656 |
| author_curate_reward | "" |
| voter | weight | wgt% | rshares | pct | time |
|---|---|---|---|---|---|
| xeldal | 0 | 1,132,628,174,386 | 2% | ||
| adol | 0 | 31,519,320,954 | 2% | ||
| enki | 0 | 389,341,728,853 | 2% | ||
| eric-boucher | 0 | 2,002,750,831 | 0.4% | ||
| thecryptodrive | 0 | 5,485,024,313 | 0.16% | ||
| mammasitta | 0 | 1,570,943,650 | 0.4% | ||
| roelandp | 0 | 39,572,024,404 | 5% | ||
| cloh76 | 0 | 527,540,484 | 0.4% | ||
| arcange | 0 | 976,534,837,313 | 5% | ||
| stea90 | 0 | 3,816,599,091 | 1% | ||
| lordvader | 0 | 7,663,874,360 | 0.8% | ||
| rmach | 0 | 1,727,727,539 | 5% | ||
| lemouth | 0 | 268,836,635,276 | 10% | ||
| lamouthe | 0 | 729,879,868 | 10% | ||
| tfeldman | 0 | 735,006,616 | 0.4% | ||
| mcsvi | 0 | 86,116,919,850 | 50% | ||
| cnfund | 0 | 1,466,057,435 | 0.8% | ||
| justyy | 0 | 3,581,743,570 | 0.8% | ||
| curie | 0 | 92,026,546,738 | 0.8% | ||
| techslut | 0 | 24,038,557,332 | 4% | ||
| slider2990 | 0 | 6,662,007,270 | 100% | ||
| steemstem | 0 | 571,481,482,313 | 10% | ||
| edb | 0 | 1,196,781,273 | 1% | ||
| walterjay | 0 | 68,336,828,906 | 5% | ||
| valth | 0 | 1,479,445,677 | 5% | ||
| metroair | 0 | 3,309,177,734 | 0.8% | ||
| dna-replication | 0 | 341,746,002 | 10% | ||
| privex | 0 | 899,717,453 | 0.8% | ||
| dhimmel | 0 | 53,542,774,200 | 2.5% | ||
| oluwatobiloba | 0 | 640,178,642 | 10% | ||
| detlev | 0 | 3,375,823,754 | 0.24% | ||
| federacion45 | 0 | 1,156,835,463 | 0.4% | ||
| iansart | 0 | 1,297,779,310 | 0.4% | ||
| mobbs | 0 | 7,150,889,674 | 5% | ||
| jerrybanfield | 0 | 2,532,846,401 | 0.8% | ||
| rt395 | 0 | 1,590,907,585 | 1.5% | ||
| bitrocker2020 | 0 | 1,491,957,593 | 0.12% | ||
| arunava | 0 | 1,086,636,301 | 0.08% | ||
| cindycam | 0 | 1,480,277,491 | 25% | ||
| deisip67 | 0 | 1,490,797,589 | 100% | ||
| juancar347 | 0 | 1,722,322,117 | 0.32% | ||
| samminator | 0 | 1,712,079,927 | 0.5% | ||
| roseri | 0 | 626,668,878 | 25% | ||
| dkmathstats | 0 | 4,644,628,804 | 100% | ||
| alexander.alexis | 0 | 5,362,848,255 | 10% | ||
| jayna | 0 | 936,796,015 | 0.16% | ||
| princessmewmew | 0 | 1,018,751,283 | 0.4% | ||
| joeyarnoldvn | 0 | 563,232,502 | 1.68% | ||
| empath | 0 | 533,246,988 | 0.4% | ||
| flatman | 0 | 670,562,130 | 0.8% | ||
| analealsuarez | 0 | 859,440,236 | 25% | ||
| minnowbooster | 0 | 1,125,472,170,555 | 20% | ||
| howo | 0 | 308,041,219,196 | 10% | ||
| tsoldovieri | 0 | 990,582,112 | 5% | ||
| steemwizards | 0 | 530,532,315 | 0.8% | ||
| yann0975 | 0 | 2,186,755,747 | 0.24% | ||
| neumannsalva | 0 | 587,104,450 | 0.4% | ||
| stayoutoftherz | 0 | 20,286,338,636 | 0.2% | ||
| abigail-dantes | 0 | 3,595,493,924 | 10% | ||
| zonguin | 0 | 611,246,221 | 2.5% | ||
| zyx066 | 0 | 686,969,913 | 0.24% | ||
| revo | 0 | 1,479,671,590 | 0.8% | ||
| rocky1 | 0 | 113,389,905,232 | 0.12% | ||
| thelordsharvest | 0 | 668,666,036 | 0.8% | ||
| therealwolf | 0 | 4,663,907,367 | 0.4% | ||
| fatman | 0 | 8,876,643,126 | 2% | ||
| meno | 0 | 3,042,514,944 | 0.4% | ||
| bhoa | 0 | 492,831,707 | 5% | ||
| enzor | 0 | 568,862,429 | 10% | ||
| dandays | 0 | 2,305,984,369 | 0.28% | ||
| sunsea | 0 | 538,181,382 | 0.4% | ||
| steveconnor | 0 | 626,071,205 | 0.4% | ||
| nicole-st | 0 | 2,299,648,239 | 0.4% | ||
| smartsteem | 0 | 19,519,802,986 | 0.4% | ||
| aboutcoolscience | 0 | 9,601,911,840 | 10% | ||
| kenadis | 0 | 2,530,229,689 | 10% | ||
| punchline | 0 | 2,119,351,445 | 0.8% | ||
| spiritabsolute | 0 | 36,828,404,875 | 100% | ||
| juecoree | 0 | 5,831,897,535 | 35% | ||
| intrepidphotos | 0 | 180,280,436,904 | 7.5% | ||
| fineartnow | 0 | 510,197,728 | 0.4% | ||
| oscarina | 0 | 722,746,074 | 10% | ||
| fragmentarion | 0 | 2,546,138,361 | 10% | ||
| utube | 0 | 624,160,123 | 0.8% | ||
| dynamicrypto | 0 | 5,495,818,496 | 7% | ||
| photohunt | 0 | 491,911,278 | 0.8% | ||
| geopolis | 0 | 613,730,939 | 10% | ||
| robertbira | 0 | 1,038,722,821 | 2.5% | ||
| alexdory | 0 | 1,463,965,783 | 10% | ||
| irgendwo | 0 | 2,516,941,936 | 0.8% | ||
| aotearoa | 0 | 40,870,177,115 | 100% | ||
| cyprianj | 0 | 2,744,073,488 | 5% | ||
| francostem | 0 | 1,324,625,451 | 10% | ||
| cryptictruth | 0 | 13,108,402,847 | 3.5% | ||
| sanderjansenart | 0 | 672,506,446 | 0.4% | ||
| gadrian | 0 | 44,197,322,811 | 7.5% | ||
| therising | 0 | 13,562,457,485 | 0.8% | ||
| de-stem | 0 | 5,379,595,946 | 9.9% | ||
| achimmertens | 0 | 830,343,215 | 0.4% | ||
| wirago | 0 | 107,508,731,726 | 100% | ||
| meanbees | 0 | 12,732,768,081 | 10% | ||
| deholt | 0 | 525,234,682 | 8.5% | ||
| diabonua | 0 | 665,602,730 | 0.4% | ||
| temitayo-pelumi | 0 | 783,970,791 | 10% | ||
| motherofalegend | 0 | 1,171,161,389 | 5% | ||
| carilinger | 0 | 14,658,465,439 | 2% | ||
| uche-nna | 0 | 597,745,479 | 0.64% | ||
| cheese4ead | 0 | 589,220,295 | 0.4% | ||
| dgi | 0 | 567,912,194 | 20% | ||
| talentclub | 0 | 677,555,631 | 0.32% | ||
| bflanagin | 0 | 763,282,881 | 0.4% | ||
| armandosodano | 0 | 1,679,264,293 | 0.4% | ||
| cleanplanet | 0 | 2,215,747,526 | 0.24% | ||
| edu-venezuela | 0 | 19,891,814,168 | 50% | ||
| thelittlebank | 0 | 3,031,163,511 | 0.4% | ||
| pboulet | 0 | 14,836,242,302 | 8% | ||
| cryptodonator | 0 | 3,633,572,871 | 100% | ||
| voter003 | 0 | 5,165,205,666 | 2.2% | ||
| brianoflondon | 0 | 5,185,053,627 | 0.12% | ||
| steemcryptosicko | 0 | 1,513,310,114 | 0.16% | ||
| stem.witness | 0 | 546,193,567 | 10% | ||
| shainemata | 0 | 8,139,132,205 | 5% | ||
| steemstorage | 0 | 938,784,816 | 0.8% | ||
| crowdwitness | 0 | 8,124,058,969 | 5% | ||
| apokruphos | 0 | 9,069,412,955 | 3% | ||
| limka | 0 | 102,733,305 | 75.15% | ||
| steemean | 0 | 9,862,282,176 | 5% | ||
| poliwalt10 | 0 | 4,865,125,993 | 10% | ||
| tinyhousecryptos | 0 | 486,666,572 | 5% | ||
| aicu | 0 | 6,073,049,755 | 0.8% | ||
| zeruxanime | 0 | 1,597,036,272 | 5% | ||
| stemgeeks | 0 | 1,763,777,463 | 50% | ||
| stemcuration | 0 | 52,344,203 | 50% | ||
| babytarazkp | 0 | 4,466,746,648 | 40% | ||
| abh12345.stem | 0 | 567,386,494 | 25% | ||
| steemstem-trig | 0 | 766,120,933 | 10% | ||
| baltai | 0 | 1,510,629,132 | 0.4% | ||
| yggdrasil.laguna | 0 | 0 | 25% | ||
| roamingsparrow | 0 | 1,205,524,886 | 2% | ||
| chapmain | 0 | 0 | 100% | ||
| stuntman.mike | 0 | 10,134,640,009 | 100% | ||
| x9ed1732b | 0 | 4,323,325,138 | 25% | ||
| stemsocial | 0 | 87,231,345,886 | 10% | ||
| noelyss | 0 | 3,063,086,017 | 5% | ||
| life-timer | 0 | 592,879,372,915 | 7.5% | ||
| aabcent | 0 | 1,730,540,938 | 0.64% | ||
| discohedge | 0 | 399,405,948 | 5.22% | ||
| dorkpower | 0 | 1,004,702,829 | 25% | ||
| dhedge | 0 | 43,432,308,292 | 5.22% | ||
| stemcur | 0 | 1,103,196,853 | 100% | ||
| brofund-stem | 0 | 856,738,820 | 50% | ||
| meritocracy | 0 | 8,919,766,935 | 0.08% | ||
| stemline | 0 | 3,233,661,672 | 25% | ||
| sillybilly | 0 | 586,671,019 | 100% | ||
| meestemboom | 0 | 476,001,569 | 25% | ||
| dhedge-drips | 0 | 230,991,151 | 5.22% | ||
| scooter77.stem | 0 | 511,906,392 | 50% | ||
| krishu.stem | 0 | 601,348,622 | 100% | ||
| ruari | 0 | 600,926,067 | 100% | ||
| peerfinance | 0 | 50,973,019,408 | 100% | ||
| yozen | 0 | 1,065,999,527 | 10% | ||
| esmeesmith | 0 | 4,539,753,725 | 100% | ||
| dronegirl | 0 | 267,697,184 | 100% | ||
| adamada.stem | 0 | 2,315,418,923 | 100% | ||
| re-public | 0 | 544,468,559 | 5% | ||
| nfttunz | 0 | 1,278,596,057 | 0.08% | ||
| holovision.stem | 0 | 1,529,892 | 50% | ||
| mirteg | 0 | 3,291,985,845 | 10% | ||
| star.stem | 0 | 1,790,470,737 | 50% | ||
| solominer.stem | 0 | 914,534,167 | 100% | ||
| aries90 | 0 | 6,230,733,394 | 0.8% | ||
| chuiiiiiiii | 0 | 622,754,463 | 69% | ||
| spirit09 | 0 | 62,811,090,459 | 100% | ||
| michupa | 0 | 531,228,333 | 2.5% | ||
| pawelszymanski | 0 | 6,678,365,225 | 100% | ||
| psyberx | 0 | 692,345,472,254 | 20% | ||
| yixn | 0 | 1,816,201,916 | 0.4% | ||
| saboin.stem | 0 | 416,529,184 | 50% | ||
| zuun.net | 0 | 5,834,186,286 | 39% | ||
| gwajnberg | 0 | 4,648,497,734 | 55% | ||
| neoxag-curator | 0 | 0 | 1% | ||
| stem-curator | 0 | 0 | 100% | ||
| vyb-curator | 0 | 0 | 10% | ||
| dondido | 0 | 3,380,856,018 | 0.8% | ||
| psyber-x | 0 | 2,047,289,706 | 20% | ||
| psyberx.witness | 0 | 6,080,507,108 | 20% | ||
| cleanyourcity | 0 | 1,532,405,901 | 0.24% | ||
| meta007 | 0 | 311,961,368 | 100% | ||
| minas-glory | 0 | 752,214,243 | 0.4% | ||
| the-grandmaster | 0 | 635,072,203 | 0.4% | ||
| the-burn | 0 | 814,840,084 | 0.4% |
 | <div class="phishy"><u><h4>You have received a __1UP__ from @gwajnberg!</h4></u></div> The @oneup-cartel will soon upvote you with:<hr> __@stem-curator, @vyb-curator, @neoxag-curator__ <hr>_And they will bring !PIZZA 🍕._ -|- <sup>[Learn more](https://peakd.com/hive-102223/@flauwy/the-curation-cartel-1up-trigger-smart-voting-mana-and-high-delegation-returns-for-14-different-tribes) about our delegation service to earn daily rewards. Join the Cartel on [Discord](https://discord.gg/mvtAneE3Ca).</sup>
| author | curation-cartel |
|---|---|
| permlink | re-r-language-how-to-create-pheatmap-chart-in-r-20230227t181858z |
| category | hive-122108 |
| json_metadata | "{"app": "beem/0.24.26"}" |
| created | 2023-02-27 18:18:57 |
| last_update | 2023-02-27 18:18:57 |
| depth | 1 |
| children | 0 |
| last_payout | 2023-03-06 18:18:57 |
| cashout_time | 1969-12-31 23:59:59 |
| total_payout_value | 0.000 HBD |
| curator_payout_value | 0.000 HBD |
| pending_payout_value | 0.000 HBD |
| promoted | 0.000 HBD |
| body_length | 654 |
| author_reputation | 1,123,882,653,763 |
| root_title | "R Language - How to Create Pheatmap Chart in R" |
| beneficiaries | [] |
| max_accepted_payout | 1,000,000.000 HBD |
| percent_hbd | 10,000 |
| post_id | 121,176,090 |
| net_rshares | 0 |
thanks for bringing that tutorial! this library is very important to do heatmaps
!1UP
| author | gwajnberg |
|---|---|
| permlink | rqr417 |
| category | hive-122108 |
| json_metadata | {"tags":["stem"],"app":"stemgeeks/0.1","canonical_url":"https://stemgeeks.net/@gwajnberg/rqr417"} |
| created | 2023-02-27 18:15:09 |
| last_update | 2023-02-27 18:15:09 |
| depth | 1 |
| children | 0 |
| last_payout | 2023-03-06 18:15:09 |
| cashout_time | 1969-12-31 23:59:59 |
| total_payout_value | 0.000 HBD |
| curator_payout_value | 0.000 HBD |
| pending_payout_value | 0.000 HBD |
| promoted | 0.000 HBD |
| body_length | 85 |
| author_reputation | 368,832,952,476,989 |
| root_title | "R Language - How to Create Pheatmap Chart in R" |
| beneficiaries | [] |
| max_accepted_payout | 1,000,000.000 HBD |
| percent_hbd | 10,000 |
| post_id | 121,175,943 |
| net_rshares | 0 |
<center>🍕 PIZZA !


I gifted <strong>$PIZZA</strong> slices here:
@curation-cartel<sub>(6/20)</sub> tipped @devpress (x1)


<sub>Learn more at https://hive.pizza!</sub></center>
| author | pizzabot |
|---|---|
| permlink | re-r-language-how-to-create-pheatmap-chart-in-r-20230227t182003z |
| category | hive-122108 |
| json_metadata | "{"app": "beem/0.24.19"}" |
| created | 2023-02-27 18:20:03 |
| last_update | 2023-02-27 18:20:03 |
| depth | 1 |
| children | 0 |
| last_payout | 2023-03-06 18:20:03 |
| cashout_time | 1969-12-31 23:59:59 |
| total_payout_value | 0.000 HBD |
| curator_payout_value | 0.000 HBD |
| pending_payout_value | 0.000 HBD |
| promoted | 0.000 HBD |
| body_length | 177 |
| author_reputation | 7,525,271,330,931 |
| root_title | "R Language - How to Create Pheatmap Chart in R" |
| beneficiaries | [] |
| max_accepted_payout | 1,000,000.000 HBD |
| percent_hbd | 10,000 |
| post_id | 121,176,129 |
| net_rshares | 0 |
<div class='text-justify'> <div class='pull-left'> <img src='https://stem.openhive.network/images/stemsocialsupport7.png'> </div> Thanks for your contribution to the <a href='/trending/hive-196387'>STEMsocial community</a>. Feel free to join us on <a href='https://discord.gg/9c7pKVD'>discord</a> to get to know the rest of us! Please consider delegating to the @stemsocial account (85% of the curation rewards are returned). You may also include @stemsocial as a beneficiary of the rewards of this post to get a stronger support. <br /> <br /> </div>
| author | stemsocial |
|---|---|
| permlink | re-devpress-r-language-how-to-create-pheatmap-chart-in-r-20230225t221356813z |
| category | hive-122108 |
| json_metadata | {"app":"STEMsocial"} |
| created | 2023-02-25 22:13:57 |
| last_update | 2023-02-25 22:13:57 |
| depth | 1 |
| children | 0 |
| last_payout | 2023-03-04 22:13:57 |
| cashout_time | 1969-12-31 23:59:59 |
| total_payout_value | 0.000 HBD |
| curator_payout_value | 0.000 HBD |
| pending_payout_value | 0.000 HBD |
| promoted | 0.000 HBD |
| body_length | 565 |
| author_reputation | 22,916,197,379,817 |
| root_title | "R Language - How to Create Pheatmap Chart in R" |
| beneficiaries | [] |
| max_accepted_payout | 1,000,000.000 HBD |
| percent_hbd | 10,000 |
| post_id | 121,122,787 |
| net_rshares | 0 |