In this post, we look at How to Create Quantile-Quantile Plot in R. This plot can be handy for those who are into the data science. And we are going to make use of the same in this post. We would be adding our sample data and show you one example out of the same. Previously, I have created [How to Create Polygon Plot in R](https://www.youtube.com/watch?v=htYVIYWkqSE). This would be a good tutorial, if you have it missed in the previous tutorials. Some of these tutorials are kind of fun for anyone who is learning the data science along the way. And also learning some new R functions in the language. I am making use of the RStudio for making the plots and also making use of the IDE for doing the plots that would make things a bit easier for myself. Some of the plots that I have done which make use of the online version of rstudio too. I am hoping that you would find this useful so give RStudio a try on this. Let's take a look at the new curve function in this tutorial. And I have created a video to give you an overview on How to Create Quantile-Quantile Plot in R. You should give this one a try. --- https://www.youtube.com/watch?v=nRHNlw2bhhU --- Let's take a look at the library and the sample data that you can use it for the QQ plot. > set.seed(11) You can now generate the vector of 100 values. > data <- rnorm(100) Now let's make use of the qqnorm function in R for plotting the Q-Q plot. You can use the following in the code. > qqnorm(data) You can check out the below output of the data.  You can also add the qline into the plot that would make the plot look like this. 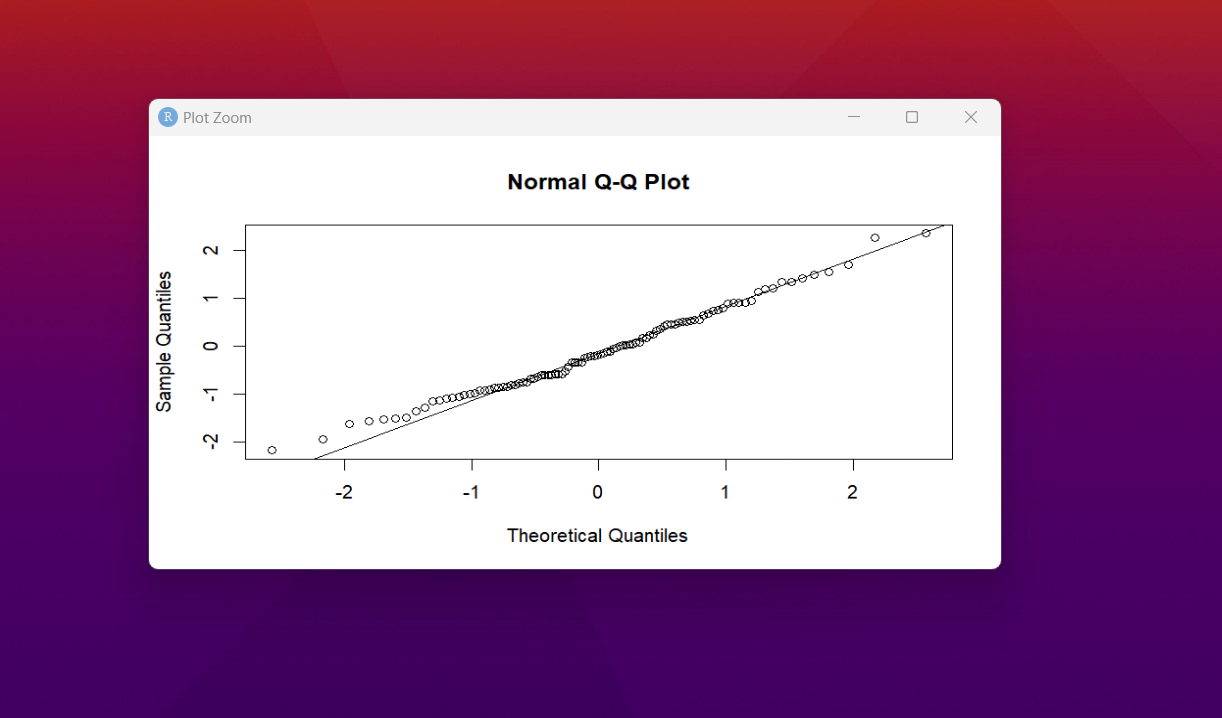 That is it. Some of the data points can be different if you happen to make use of your own data. And having a good large data set would make things really good. Like say you have some govt data or the large data that would change the visualization as well. That's pretty cool to experiment. I have completed this tutorial now. I have upto this December 2023, to post all these plots and the charts. And that would give you an idea on how much expansive for the chart that you would be making use of for your data visualization. It'd be pretty cool to work with the data here. Now I have been hustling hard but the youtube has been going on pretty slow. And the earning has been low too. So if you share, subscribe and also like the content. That would help me a lot. I tend to have been in need of the signups and the subscribers that would help me with the overall support too. So do please keep in tab for my content. If you happen to like this content, do give me feedback over there and that would help me improve my efforts in near future.
| author | devpress |
|---|---|
| permlink | r-language-how-to-create-quantile-quantile-plot-in-r |
| category | hive-122108 |
| json_metadata | {"tags":["stem","vyb","cent","programming"],"image":["https://img.youtube.com/vi/nRHNlw2bhhU/0.jpg","https://images.hive.blog/DQmYqqEkhWWyZuVgnxkA7MYEKfc2HwhHXFyipZYs8nSHftS/qqpllot.png","https://images.hive.blog/DQmPsy1p27jCcrsRdbHu2beVNFKFx7VDYF3WXT7WxGZzdUP/qqline.png"],"links":["https://www.youtube.com/watch?v=htYVIYWkqSE"],"app":"hiveblog/0.1","format":"markdown"} |
| created | 2023-07-29 15:48:48 |
| last_update | 2023-07-29 15:48:48 |
| depth | 0 |
| children | 1 |
| last_payout | 2023-08-05 15:48:48 |
| cashout_time | 1969-12-31 23:59:59 |
| total_payout_value | 1.157 HBD |
| curator_payout_value | 1.117 HBD |
| pending_payout_value | 0.000 HBD |
| promoted | 0.000 HBD |
| body_length | 2,870 |
| author_reputation | 55,061,325,071,240 |
| root_title | "R Language - How to Create Quantile-Quantile Plot in R" |
| beneficiaries | [] |
| max_accepted_payout | 1,000,000.000 HBD |
| percent_hbd | 10,000 |
| post_id | 125,748,250 |
| net_rshares | 4,936,282,120,525 |
| author_curate_reward | "" |
| voter | weight | wgt% | rshares | pct | time |
|---|---|---|---|---|---|
| eric-boucher | 0 | 2,085,391,845 | 0.4% | ||
| thecryptodrive | 0 | 7,515,541,423 | 0.16% | ||
| roelandp | 0 | 44,940,940,963 | 5% | ||
| cloh76 | 0 | 533,137,092 | 0.4% | ||
| stea90 | 0 | 814,588,312 | 1% | ||
| akipponn | 0 | 715,023,251 | 5% | ||
| lordvader | 0 | 6,601,096,926 | 0.8% | ||
| lemouth | 0 | 287,439,267,846 | 10% | ||
| lamouthe | 0 | 740,347,548 | 10% | ||
| tfeldman | 0 | 742,651,739 | 0.4% | ||
| metabs | 0 | 1,051,977,140 | 10% | ||
| mcsvi | 0 | 123,017,336,678 | 50% | ||
| cnfund | 0 | 1,586,229,564 | 0.8% | ||
| boxcarblue | 0 | 1,667,967,621 | 0.4% | ||
| justyy | 0 | 4,778,907,954 | 0.8% | ||
| curie | 0 | 64,998,047,854 | 0.8% | ||
| techslut | 0 | 24,196,844,467 | 4% | ||
| steemstem | 0 | 181,578,984,837 | 10% | ||
| edb | 0 | 930,879,930 | 1% | ||
| walterjay | 0 | 61,030,560,255 | 5% | ||
| valth | 0 | 1,544,138,736 | 5% | ||
| metroair | 0 | 3,569,072,903 | 0.8% | ||
| voter | 0 | 5,210,117,356 | 100% | ||
| dna-replication | 0 | 344,600,709 | 10% | ||
| dhimmel | 0 | 52,036,208,545 | 2.5% | ||
| detlev | 0 | 3,672,773,682 | 0.24% | ||
| federacion45 | 0 | 1,222,467,102 | 0.4% | ||
| gamersclassified | 0 | 504,079,996 | 0.4% | ||
| iansart | 0 | 1,509,820,766 | 0.4% | ||
| mobbs | 0 | 15,246,603,640 | 5% | ||
| eliel | 0 | 1,934,972,344 | 0.8% | ||
| jerrybanfield | 0 | 2,496,495,725 | 0.8% | ||
| rt395 | 0 | 2,007,036,157 | 1.5% | ||
| bitrocker2020 | 0 | 1,482,157,885 | 0.12% | ||
| sustainablyyours | 0 | 4,174,350,100 | 5% | ||
| arunava | 0 | 3,299,988,559 | 0.32% | ||
| cindycam | 0 | 2,447,765,402 | 22.5% | ||
| deisip67 | 0 | 2,410,046,361 | 100% | ||
| samminator | 0 | 7,050,380,868 | 5% | ||
| roseri | 0 | 573,820,407 | 22.5% | ||
| enjar | 0 | 5,715,401,704 | 0.72% | ||
| lorenzor | 0 | 1,332,397,460 | 50% | ||
| firstamendment | 0 | 85,186,290,132 | 50% | ||
| alexander.alexis | 0 | 6,031,801,804 | 10% | ||
| dandesign86 | 0 | 15,616,987,056 | 8% | ||
| princessmewmew | 0 | 1,113,992,618 | 0.4% | ||
| joeyarnoldvn | 0 | 555,726,522 | 1.68% | ||
| ufv | 0 | 3,006,808,420 | 50% | ||
| gunthertopp | 0 | 10,707,939,196 | 0.2% | ||
| empath | 0 | 553,445,471 | 0.4% | ||
| minnowbooster | 0 | 1,042,864,269,735 | 20% | ||
| howo | 0 | 320,646,488,063 | 10% | ||
| tsoldovieri | 0 | 1,006,581,476 | 5% | ||
| steemwizards | 0 | 553,078,793 | 0.8% | ||
| neumannsalva | 0 | 633,113,429 | 0.4% | ||
| stayoutoftherz | 0 | 19,959,176,855 | 0.2% | ||
| abigail-dantes | 0 | 3,621,956,179 | 10% | ||
| zonguin | 0 | 489,550,789 | 2.5% | ||
| investingpennies | 0 | 2,984,292,978 | 0.8% | ||
| jasonbu | 0 | 5,343,773,410 | 20% | ||
| val.halla | 0 | 2,869,753,262 | 10% | ||
| iamphysical | 0 | 756,104,062 | 90% | ||
| zyx066 | 0 | 765,873,278 | 0.24% | ||
| revo | 0 | 1,566,814,239 | 0.8% | ||
| azulear | 0 | 1,250,826,794 | 100% | ||
| psicoluigi | 0 | 778,408,373 | 50% | ||
| rocky1 | 0 | 110,486,682,447 | 0.12% | ||
| thelordsharvest | 0 | 716,594,782 | 0.8% | ||
| sumant | 0 | 1,870,387,417 | 0.4% | ||
| aidefr | 0 | 983,063,667 | 5% | ||
| inthenow | 0 | 18,956,574,407 | 20% | ||
| msp-foundation | 0 | 145,252,500 | 100% | ||
| meno | 0 | 3,630,777,812 | 0.4% | ||
| doifeellucky | 0 | 2,190,362,724 | 0.4% | ||
| enzor | 0 | 609,685,807 | 10% | ||
| sunsea | 0 | 646,570,811 | 0.4% | ||
| eonwarped | 0 | 18,158,790,965 | 1.25% | ||
| postpromoter | 0 | 226,078,516,916 | 10% | ||
| bluefinstudios | 0 | 523,737,268 | 0.24% | ||
| steveconnor | 0 | 654,633,244 | 0.4% | ||
| feltoxxx | 0 | 8,363,059,966 | 100% | ||
| sandracarrascal | 0 | 497,459,012 | 50% | ||
| kenadis | 0 | 2,674,380,611 | 10% | ||
| madridbg | 0 | 3,913,447,907 | 10% | ||
| punchline | 0 | 2,298,249,706 | 0.8% | ||
| sco | 0 | 2,607,900,465 | 10% | ||
| ennyta | 0 | 975,893,129 | 50% | ||
| juecoree | 0 | 584,905,201 | 7% | ||
| jongolson | 0 | 399,246,427,457 | 25% | ||
| bartheek | 0 | 1,901,478,777 | 0.8% | ||
| ydavgonzalez | 0 | 2,364,808,314 | 10% | ||
| intrepidphotos | 0 | 2,080,126,675 | 7.5% | ||
| fineartnow | 0 | 530,650,986 | 0.4% | ||
| communitybank | 0 | 600,322,888 | 0.8% | ||
| fragmentarion | 0 | 2,622,841,373 | 10% | ||
| utube | 0 | 669,259,463 | 0.8% | ||
| dynamicrypto | 0 | 3,597,321,200 | 1% | ||
| neneandy | 0 | 883,577,272 | 0.8% | ||
| pab.ink | 0 | 6,596,469,200 | 5% | ||
| sportscontest | 0 | 836,353,985 | 0.8% | ||
| pandasquad | 0 | 1,769,415,146 | 0.8% | ||
| tobias-g | 0 | 45,077,773,912 | 15% | ||
| miguelangel2801 | 0 | 782,178,898 | 50% | ||
| fantasycrypto | 0 | 649,183,114 | 0.8% | ||
| ericburgoyne | 0 | 29,026,063,736 | 50% | ||
| emiliomoron | 0 | 1,461,492,637 | 5% | ||
| photohunt | 0 | 537,474,653 | 0.8% | ||
| geopolis | 0 | 618,581,798 | 10% | ||
| robertbira | 0 | 1,037,797,022 | 2.5% | ||
| alexdory | 0 | 1,559,711,887 | 10% | ||
| irgendwo | 0 | 2,668,508,671 | 0.8% | ||
| cyprianj | 0 | 5,731,658,593 | 5% | ||
| melvin7 | 0 | 6,413,055,923 | 5% | ||
| francostem | 0 | 1,334,661,412 | 10% | ||
| endopediatria | 0 | 691,761,706 | 20% | ||
| chrislybear | 0 | 10,389,695,734 | 50% | ||
| croctopus | 0 | 1,407,358,822 | 100% | ||
| superlotto | 0 | 2,410,690,681 | 0.8% | ||
| bscrypto | 0 | 2,010,201,213 | 0.4% | ||
| movingman | 0 | 500,284,673 | 20% | ||
| tomastonyperez | 0 | 16,820,716,676 | 50% | ||
| elvigia | 0 | 11,020,219,961 | 50% | ||
| sanderjansenart | 0 | 694,661,372 | 0.4% | ||
| qberry | 0 | 497,990,480 | 0.4% | ||
| braaiboy | 0 | 1,469,155,515 | 0.4% | ||
| therising | 0 | 15,485,674,384 | 0.8% | ||
| scruffy23 | 0 | 20,013,435,385 | 50% | ||
| de-stem | 0 | 5,418,328,885 | 9.9% | ||
| josedelacruz | 0 | 4,714,837,140 | 50% | ||
| achimmertens | 0 | 956,291,138 | 0.4% | ||
| erickyoussif | 0 | 614,326,323 | 100% | ||
| primersion | 0 | 311,702,043,156 | 20% | ||
| deholt | 0 | 536,776,040 | 8.5% | ||
| celinavisaez | 0 | 9,920,860,422 | 30% | ||
| diabonua | 0 | 762,129,713 | 0.4% | ||
| minerthreat | 0 | 495,423,210 | 0.4% | ||
| nateaguila | 0 | 142,334,144,188 | 5% | ||
| temitayo-pelumi | 0 | 839,086,312 | 10% | ||
| andrick | 0 | 850,468,246 | 50% | ||
| doctor-cog-diss | 0 | 7,679,018,270 | 10% | ||
| acont | 0 | 11,597,258,833 | 50% | ||
| uche-nna | 0 | 864,775,950 | 0.64% | ||
| drawmeaship | 0 | 5,253,520,414 | 50% | ||
| citizendog | 0 | 700,961,402 | 0.8% | ||
| cheese4ead | 0 | 625,956,936 | 0.4% | ||
| mafufuma | 0 | 7,443,468,329 | 1% | ||
| gaottantacinque | 0 | 230,088,643 | 100% | ||
| cryptojiang | 0 | 129,603,537,479 | 100% | ||
| nattybongo | 0 | 5,508,086,647 | 10% | ||
| bflanagin | 0 | 1,017,007,302 | 0.4% | ||
| armandosodano | 0 | 1,861,076,767 | 0.4% | ||
| yourmind | 0 | 15,192,218,408 | 100% | ||
| acousticguitar | 0 | 14,087,939,338 | 50% | ||
| gerdtrudroepke | 0 | 9,378,763,663 | 7% | ||
| reinaseq | 0 | 7,261,473,153 | 100% | ||
| kylealex | 0 | 4,674,746,857 | 10% | ||
| gasaeightyfive | 0 | 424,162,147 | 100% | ||
| cubapl | 0 | 552,055,992 | 5% | ||
| orlandogonzalez | 0 | 3,239,391,835 | 25% | ||
| fran.frey | 0 | 4,140,468,228 | 50% | ||
| edu-venezuela | 0 | 16,687,268,278 | 45% | ||
| thelittlebank | 0 | 2,830,017,093 | 0.4% | ||
| pboulet | 0 | 24,195,438,646 | 8% | ||
| cryptodonator | 0 | 3,852,960,323 | 100% | ||
| stem-espanol | 0 | 18,764,373,377 | 100% | ||
| cribbio | 0 | 921,003,076 | 100% | ||
| cliffagreen | 0 | 4,833,061,710 | 10% | ||
| aleestra | 0 | 12,177,002,768 | 80% | ||
| brianoflondon | 0 | 9,715,300,202 | 0.2% | ||
| giulyfarci52 | 0 | 1,692,204,088 | 50% | ||
| esthersanchez | 0 | 4,428,933,063 | 60% | ||
| kristall97 | 0 | 24,499,058,591 | 100% | ||
| steemcryptosicko | 0 | 1,469,250,238 | 0.16% | ||
| cakemonster | 0 | 506,938,507 | 0.8% | ||
| stem.witness | 0 | 553,147,867 | 10% | ||
| hiddendragon | 0 | 635,516,759 | 38% | ||
| double-negative | 0 | 521,897,682 | 20% | ||
| vaultec | 0 | 5,246,576,492 | 12% | ||
| steemstorage | 0 | 999,833,074 | 0.8% | ||
| aqua.nano | 0 | 417,444,533 | 100% | ||
| crowdwitness | 0 | 12,941,457,482 | 5% | ||
| steemean | 0 | 9,999,964,450 | 5% | ||
| extravagante | 0 | 1,736,443,949 | 100% | ||
| pedrobrito2004 | 0 | 12,406,628,224 | 14% | ||
| livingfreedom | 0 | 647,968,570 | 100% | ||
| walterprofe | 0 | 6,037,765,788 | 5% | ||
| zeruxanime | 0 | 1,730,627,946 | 5% | ||
| clicktrackprofit | 0 | 26,062,552,627 | 12.5% | ||
| lisamgentile1961 | 0 | 50,378,337,369 | 30% | ||
| dechuck | 0 | 4,523,940,226 | 12.5% | ||
| precarious | 0 | 480,531,749 | 50% | ||
| steemstem-trig | 0 | 163,851,085 | 10% | ||
| baltai | 0 | 833,178,102 | 0.4% | ||
| dmoonfire | 0 | 30,818,423,891 | 71% | ||
| atheistrepublic | 0 | 836,340,874 | 0.4% | ||
| ibt-survival | 0 | 36,531,748,229 | 10% | ||
| appics.tutorial | 0 | 36,014,251,588 | 100% | ||
| chapmain | 0 | 0 | 100% | ||
| lightpaintershub | 0 | 661,962,334 | 1% | ||
| peterale | 0 | 492,162,005 | 0.4% | ||
| fsm-core | 0 | 11,654,410,783 | 50% | ||
| stemsocial | 0 | 80,875,093,544 | 10% | ||
| holoferncro | 0 | 4,463,727,522 | 10% | ||
| hiveonboard | 0 | 639,215,522 | 0.4% | ||
| noelyss | 0 | 3,585,299,019 | 5% | ||
| quinnertronics | 0 | 14,717,993,711 | 7% | ||
| gohive | 0 | 13,672,706,370 | 100% | ||
| aabcent | 0 | 1,831,291,763 | 0.64% | ||
| ctptalk | 0 | 116,627,594,042 | 25% | ||
| meritocracy | 0 | 9,010,410,217 | 0.08% | ||
| stayten | 0 | 12,942,461,046 | 25% | ||
| dcrops | 0 | 5,559,928,197 | 0.4% | ||
| traderhive | 0 | 1,875,980,130 | 0.8% | ||
| cbridges573 | 0 | 1,354,864,026 | 7.5% | ||
| mayorkeys | 0 | 19,420,538,156 | 30% | ||
| moraviareosa | 0 | 9,728,263 | 100% | ||
| nfttunz | 0 | 1,198,478,237 | 0.08% | ||
| luisestaba23 | 0 | 480,538,542 | 50% | ||
| holovision.stem | 0 | 1,627,517,248 | 100% | ||
| podping | 0 | 1,046,518,456 | 0.2% | ||
| mayberlys | 0 | 2,122,625,235 | 50% | ||
| irivers | 0 | 290,334,196 | 100% | ||
| cryptoccshow | 0 | 1,621,952,146 | 12.5% | ||
| seinkalar | 0 | 1,143,151,225 | 0.8% | ||
| aries90 | 0 | 6,705,639,573 | 0.8% | ||
| onewolfe | 0 | 480,215,120 | 25% | ||
| martinthemass | 0 | 595,201,725 | 100% | ||
| axelx12 | 0 | 1,741,675,523 | 100% | ||
| simonm32 | 0 | 1,462,697,734 | 90% | ||
| yixn | 0 | 7,341,526,174 | 0.4% | ||
| crypt0gnome | 0 | 613,054,012 | 0.16% | ||
| zuun.net | 0 | 5,860,065,425 | 37% | ||
| ctp-curator | 0 | 768,311 | 100% | ||
| dondido | 0 | 1,375,370,984 | 0.8% | ||
| njclabaugh | 0 | 480,516,198 | 100% | ||
| prosocialise | 0 | 8,119,421,056 | 5% | ||
| mugueto2022 | 0 | 552,579,554 | 20% | ||
| soyjoselopez | 0 | 482,720,212 | 20% | ||
| sbtofficial | 0 | 667,169,083 | 0.4% | ||
| daje10 | 0 | 18,532,279,583 | 50% | ||
| cryptomaso | 0 | 9,128,392,982 | 100% | ||
| the-burn | 0 | 480,384,089 | 0.4% | ||
| brofund-ctp | 0 | 859,466,024 | 50% | ||
| reverio | 0 | 1,205,945,434 | 5% | ||
| stem-shturm | 0 | 101,805,784 | 100% | ||
| kryptof | 0 | 1,960,099,603 | 8% | ||
| master-vkbt | 0 | 85,936,826 | 100% | ||
| master-vibes | 0 | 86,761,462 | 100% | ||
| laro-racing | 0 | 699,840,630 | 0.24% | ||
| earn.vote | 0 | 2,974,734,663 | 100% |
<div class='text-justify'> <div class='pull-left'> <img src='https://stem.openhive.network/images/stemsocialsupport7.png'> </div> Thanks for your contribution to the <a href='/trending/hive-196387'>STEMsocial community</a>. Feel free to join us on <a href='https://discord.gg/9c7pKVD'>discord</a> to get to know the rest of us! Please consider delegating to the @stemsocial account (85% of the curation rewards are returned). You may also include @stemsocial as a beneficiary of the rewards of this post to get a stronger support. <br /> <br /> </div>
| author | stemsocial |
|---|---|
| permlink | re-devpress-r-language-how-to-create-quantile-quantile-plot-in-r-20230729t195602450z |
| category | hive-122108 |
| json_metadata | {"app":"STEMsocial"} |
| created | 2023-07-29 19:56:03 |
| last_update | 2023-07-29 19:56:03 |
| depth | 1 |
| children | 0 |
| last_payout | 2023-08-05 19:56:03 |
| cashout_time | 1969-12-31 23:59:59 |
| total_payout_value | 0.000 HBD |
| curator_payout_value | 0.000 HBD |
| pending_payout_value | 0.000 HBD |
| promoted | 0.000 HBD |
| body_length | 565 |
| author_reputation | 22,918,491,691,707 |
| root_title | "R Language - How to Create Quantile-Quantile Plot in R" |
| beneficiaries | [] |
| max_accepted_payout | 1,000,000.000 HBD |
| percent_hbd | 10,000 |
| post_id | 125,753,908 |
| net_rshares | 0 |