Hi there. In this mathematics based post, I cover graphing linear inequalities. It is assumed that the reader is familiar with linear equations and the algebra associated with linear functions. As usual, I use QuickLatex.com for math text rendering. <center><img src="https://cdn.pixabay.com/photo/2016/03/03/10/20/mathematics-1233876_960_720.jpg" /></center> <center><a href="https://cdn.pixabay.com/photo/2016/03/03/10/20/mathematics-1233876_960_720.jpg">Pixabay Image Source</a></center> ## Topics --- * Review Of Linear Equations * Isolate For y First * Graph The Inequalities ## Review Of Linear Equations --- The equation for a linear function is of the following form: <center>https://quicklatex.com/cache3/bc/ql_43f37d08451711818d2444f5c31764bc_l3.png</center> The variable `y` is the dependent variable that depends on the value of the independent variable `x`. The value of `b` is the y-intercept or the value of `y` when `x` is 0. To represent the change in `y` for every one unit increase of `x`, we have the slope value `m`. An example of a linear function is `y = 10x + 20` . I show a screenshot graph below. 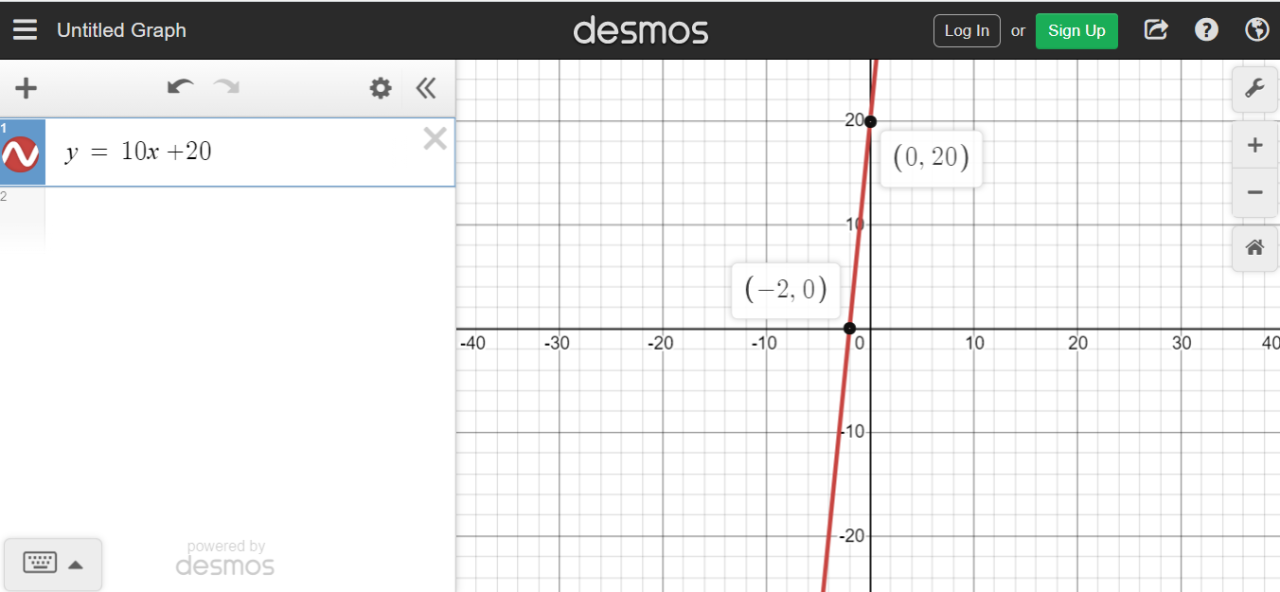 ## Isolate For y First --- Not all equations will have the dependent variable `y` already isolated. This is where algebra comes into play. Isolating for `y` is the key step before graphing the linear inequality. **Example One** Solve for y in `2y - 6 > x`. <center>https://quicklatex.com/cache3/3b/ql_db3792e02e7da81dc4d428e4a42af13b_l3.png</center> The slope for this linear function is one half. Three is the y-intercept here. **Example Two** Isolate for y in `-2x + 5y < 10`. <center>https://quicklatex.com/cache3/e7/ql_29fcd5b71695bc4eda08b59beef22be7_l3.png</center> With this linear function, the y-intercept is 2 and the slope is two fifths. **Example Three** Isolate for y in `-10y \geq 200`. When it comes to multiplying or dividing by a negative sign, do make sure to change the direction of the inequality sign. <center>https://quicklatex.com/cache3/7a/ql_c32a05b4db8b85b9a8cbc97eedfd027a_l3.png</center> ## Graph The Inequalities --- Once y is isolated, the graphing can commence. Here are some examples. **Example One** In example one from the previous section we obtained `y > x/2 + 3`. On graphing paper, graph the line `y > x/2 + 3` first. The line should be dashed instead of a solid line. This is because we have a strict inequality. If it was greater or equal to with this symbol ≥ then the line can be solid. As `y` is greater than the line, the shaded region is (vertically) above the line. In the Desmos screenshot below, the shaded region above the dashed line is red. 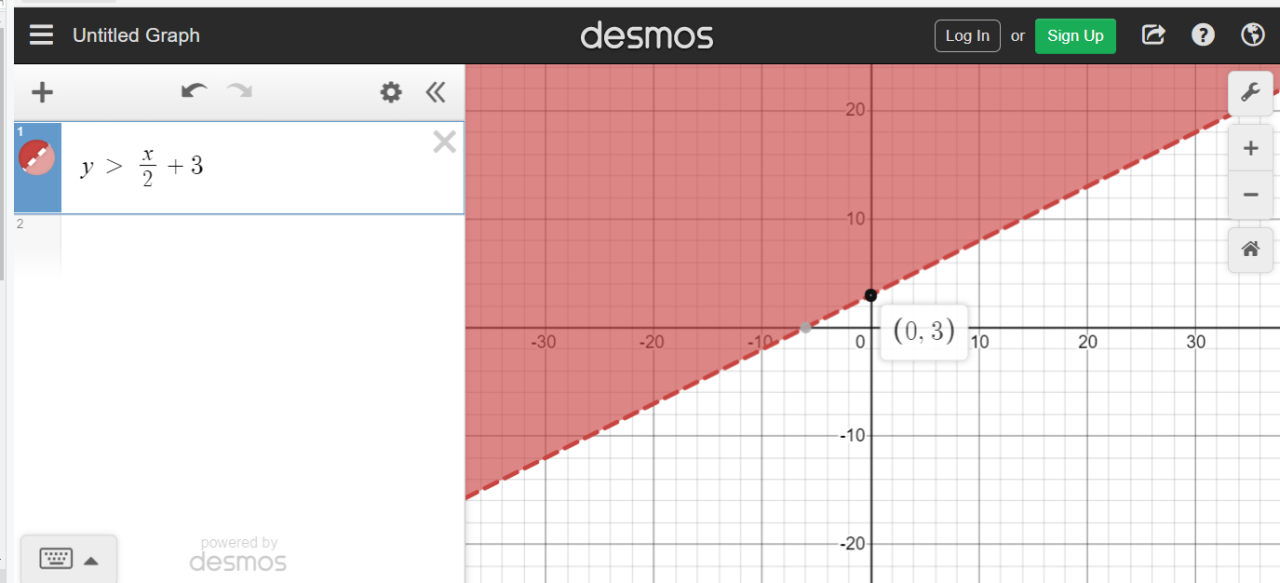 **Example Two** What would the graph look like for `-2x + 5y < 10` back in example two from the previous section? Isolating for `y` yielded `y < 2x/5 + 2`. The line `y < 2x/5 + 2` is graphed first. As the inequality sign is less than (<), the line is dashed. In addition, the region below the line is shaded. 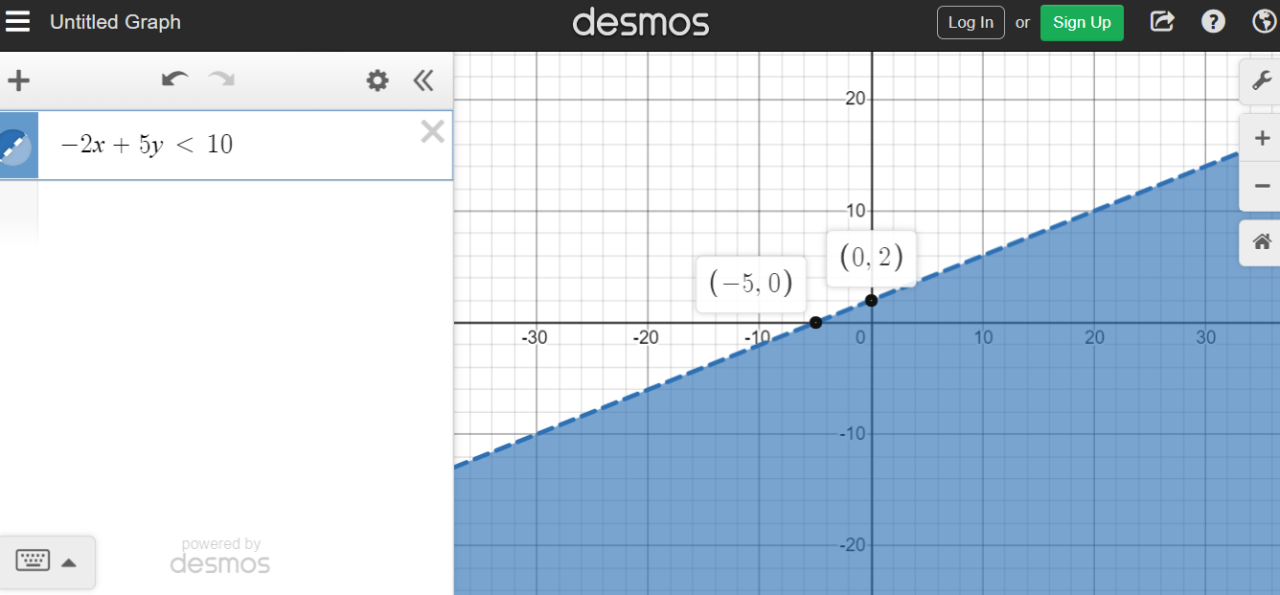 **Example Three** Graph the inequality `-2y + 9x ≥ -2`. With this do be careful with the negative sign. Anytime you multiply or divide by a negative number, do change the direction of the inequality sign. <center>https://quicklatex.com/cache3/ed/ql_e39bff8832ce8e9d05c651f67e21e7ed_l3.png</center> 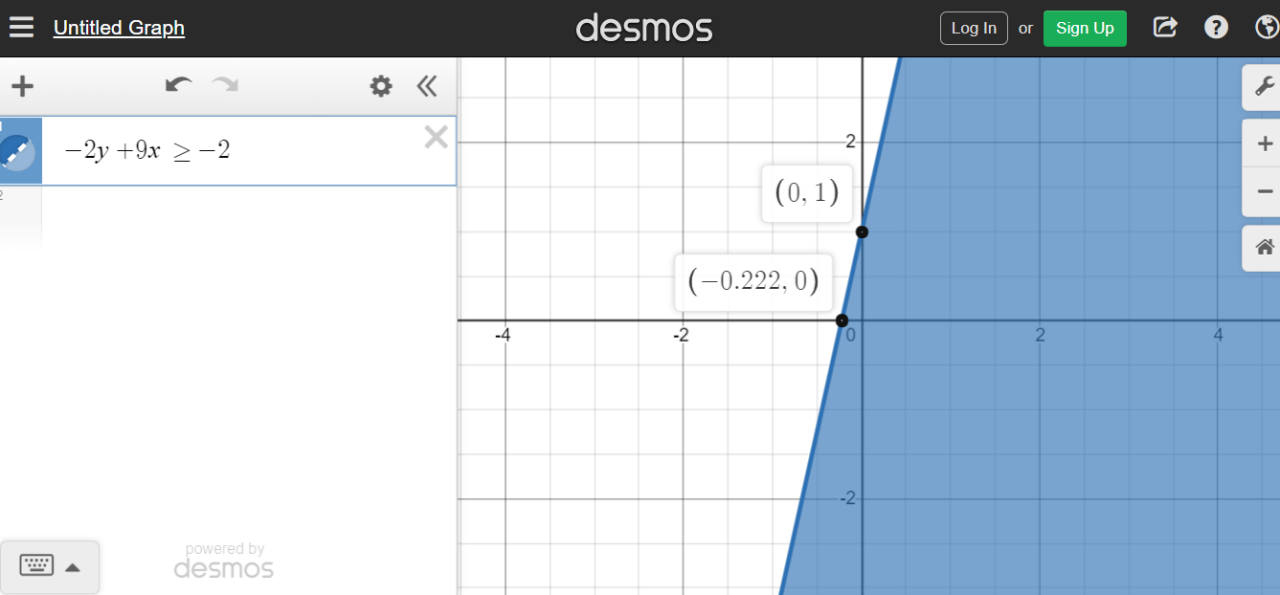 **Example Four - Phone Plan Charges** Suppose you buy a phone outright at its full costs. The cost for this new phone is about $2700 CAD. To supplement the cost of this phone, the phone plan is a $80 CAD phone plan per month. Keeping overage fees in mind, what would be total costs paid over time look like with a graph? The shaded region would represents total costs paid if overage fees occurred. <center>https://quicklatex.com/cache3/1d/ql_92f3f9fd2496dec723c33276143d031d_l3.png</center> where `n` is the number of months paid and `P(x)` is the total amount paid to the phone company at month `n`. As we may incur extra fees, we have this inequality: <center>https://quicklatex.com/cache3/fe/ql_f4cd29a205b0502681f2a0d8329747fe_l3.png</center> The Desmos screenshot of this does not look great. Having a large slope of 80 makes the line steep to the point that it is almost vertical. The shaded region is above the dashed line is coloured blue. 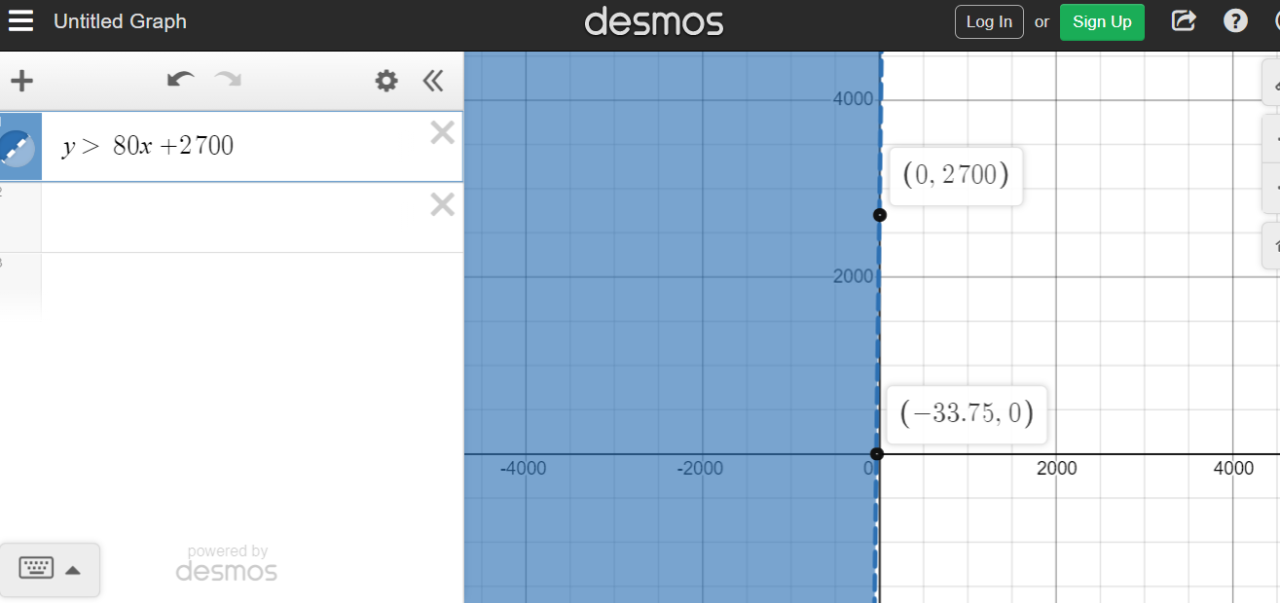 <center>Thank you for reading.</center>
| author | dkmathstats |
|---|---|
| permlink | graphing-linear-inequalities |
| category | hive-196387 |
| json_metadata | "{"tags":["math","mathematics","stem","algebra","graphing","education","inequality"],"image":["https://cdn.pixabay.com/photo/2016/03/03/10/20/mathematics-1233876_960_720.jpg","https://quicklatex.com/cache3/bc/ql_43f37d08451711818d2444f5c31764bc_l3.png","https://res.cloudinary.com/drrz8xekm/image/upload/v1614873393/n0pen1tunk6zxtxc6s5h.png","https://quicklatex.com/cache3/3b/ql_db3792e02e7da81dc4d428e4a42af13b_l3.png","https://quicklatex.com/cache3/e7/ql_29fcd5b71695bc4eda08b59beef22be7_l3.png","https://quicklatex.com/cache3/7a/ql_c32a05b4db8b85b9a8cbc97eedfd027a_l3.png","https://res.cloudinary.com/drrz8xekm/image/upload/v1614873580/svlnxvjgttyfwyfrnbat.png","https://res.cloudinary.com/drrz8xekm/image/upload/v1614873639/revs5nik84yh5u6anm6u.png","https://quicklatex.com/cache3/ed/ql_e39bff8832ce8e9d05c651f67e21e7ed_l3.png","https://res.cloudinary.com/drrz8xekm/image/upload/v1614874341/f43ahrjzpfbwgjryzlbk.png","https://quicklatex.com/cache3/1d/ql_92f3f9fd2496dec723c33276143d031d_l3.png","https://quicklatex.com/cache3/fe/ql_f4cd29a205b0502681f2a0d8329747fe_l3.png","https://res.cloudinary.com/drrz8xekm/image/upload/v1614874318/e4t77xsuzclsqbutvuhd.png"],"links":["https://cdn.pixabay.com/photo/2016/03/03/10/20/mathematics-1233876_960_720.jpg"],"app":"hiveblog/0.1","format":"markdown","description":"A mathematics learning guide for graphing linear inequalities. Examples and screenshots provided."}" |
| created | 2021-03-04 16:23:18 |
| last_update | 2021-03-04 16:26:12 |
| depth | 0 |
| children | 1 |
| last_payout | 2021-03-11 16:23:18 |
| cashout_time | 1969-12-31 23:59:59 |
| total_payout_value | 5.570 HBD |
| curator_payout_value | 4.404 HBD |
| pending_payout_value | 0.000 HBD |
| promoted | 0.000 HBD |
| body_length | 4,980 |
| author_reputation | 151,258,400,167,903 |
| root_title | "Graphing Linear Inequalities" |
| beneficiaries | [] |
| max_accepted_payout | 1,000,000.000 HBD |
| percent_hbd | 10,000 |
| post_id | 102,181,141 |
| net_rshares | 22,796,750,479,660 |
| author_curate_reward | "" |
| voter | weight | wgt% | rshares | pct | time |
|---|---|---|---|---|---|
| tombstone | 0 | 16,212,155,307 | 0.75% | ||
| modeprator | 0 | 609,279,287 | 80% | ||
| justtryme90 | 0 | 304,441,299,834 | 10% | ||
| eric-boucher | 0 | 2,605,039,065 | 0.6% | ||
| thecryptodrive | 0 | 10,294,102,620 | 0.24% | ||
| mammasitta | 0 | 3,324,543,033 | 0.6% | ||
| skapaneas | 0 | 6,013,956,690 | 3% | ||
| roelandp | 0 | 247,919,234,754 | 5% | ||
| redpalestino | 0 | 3,062,806,161 | 25% | ||
| cloh76 | 0 | 812,935,211 | 0.6% | ||
| lichtblick | 0 | 631,708,007 | 0.36% | ||
| stephen.king989 | 0 | 1,903,278,952 | 0.6% | ||
| djennyfloro | 0 | 1,315,319,643 | 10% | ||
| bidnat | 0 | 67,288,400 | 6% | ||
| kpine | 0 | 1,821,287,143,801 | 10% | ||
| rmach | 0 | 24,624,640,948 | 100% | ||
| lemouth | 0 | 195,448,059,257 | 10% | ||
| notconvinced | 0 | 5,502,281,532 | 10% | ||
| charlie777pt | 0 | 5,270,588,033 | 5% | ||
| alaqrab | 0 | 656,082,167 | 0.6% | ||
| lamouthe | 0 | 803,163,798 | 10% | ||
| holoz0r | 0 | 5,395,769,574 | 1.8% | ||
| tfeldman | 0 | 1,149,546,498 | 0.6% | ||
| mcsvi | 0 | 117,987,685,841 | 50% | ||
| cnfund | 0 | 7,499,842,213 | 0.6% | ||
| michelle.gent | 0 | 571,391,825 | 0.24% | ||
| curie | 0 | 165,115,814,203 | 1.2% | ||
| modernzorker | 0 | 536,407,992 | 0.84% | ||
| reddust | 0 | 1,777,429,339 | 0.36% | ||
| techslut | 0 | 23,041,740,169 | 4% | ||
| slider2990 | 0 | 763,046,660 | 25% | ||
| steemstem | 0 | 651,145,047,464 | 10% | ||
| zorg67 | 0 | 579,794,880 | 100% | ||
| walterjay | 0 | 31,850,122,944 | 5% | ||
| valth | 0 | 1,126,767,994 | 5% | ||
| driptorchpress | 0 | 563,438,849 | 0.6% | ||
| sardrt | 0 | 4,355,534,647 | 10% | ||
| dna-replication | 0 | 309,355,760 | 10% | ||
| steemitboard | 0 | 11,610,859,937 | 3% | ||
| dhimmel | 0 | 172,688,322,606 | 2.5% | ||
| sokha | 0 | 1,640,936,724 | 12.5% | ||
| federacion45 | 0 | 2,046,000,416 | 0.6% | ||
| mobbs | 0 | 18,275,910,128 | 5% | ||
| roomservice | 0 | 2,778,336,951 | 1.87% | ||
| yehey | 0 | 25,777,199,789 | 1.2% | ||
| samminator | 0 | 8,701,296,766 | 5% | ||
| robinhaney | 0 | 1,211,483,122 | 0.6% | ||
| mahdiyari | 0 | 733,502,674,962 | 80% | ||
| lorenzor | 0 | 9,584,255,091 | 50% | ||
| firstamendment | 0 | 54,308,438,811 | 50% | ||
| alexander.alexis | 0 | 5,629,908,440 | 10% | ||
| jayna | 0 | 1,023,828,163 | 0.24% | ||
| gunthertopp | 0 | 17,961,450,393 | 0.32% | ||
| tngflx | 0 | 1,473,078,724 | 0.36% | ||
| ludmila.kyriakou | 0 | 664,993,543 | 3% | ||
| touchman | 0 | 176,334,959,401 | 100% | ||
| flatman | 0 | 878,826,519 | 1.2% | ||
| allcapsonezero | 0 | 999,682,668 | 0.6% | ||
| minnowbooster | 0 | 1,712,823,842,287 | 20% | ||
| howo | 0 | 303,371,043,456 | 10% | ||
| tsoldovieri | 0 | 987,059,564 | 5% | ||
| themarkymark | 0 | 3,143,697,839,026 | 10% | ||
| neumannsalva | 0 | 574,096,083 | 0.6% | ||
| stayoutoftherz | 0 | 18,682,186,308 | 0.6% | ||
| abigail-dantes | 0 | 3,778,337,016 | 10% | ||
| sciencevienna | 0 | 3,745,447,779 | 5.5% | ||
| joseg | 0 | 1,338,711,894 | 80% | ||
| investingpennies | 0 | 3,269,292,837 | 1.2% | ||
| val.halla | 0 | 2,869,753,262 | 10% | ||
| lizelle | 0 | 1,303,234,353 | 0.6% | ||
| redrica | 0 | 647,317,684 | 0.6% | ||
| jorgevandeperre | 0 | 4,118,349,293 | 100% | ||
| iamphysical | 0 | 7,720,594,059 | 90% | ||
| felixrodriguez | 0 | 1,859,544,387 | 35% | ||
| zyx066 | 0 | 1,781,776,606 | 0.6% | ||
| nainaztengra | 0 | 86,542,051,824 | 13% | ||
| betterthanhome | 0 | 1,414,403,438 | 1.2% | ||
| revo | 0 | 3,840,901,296 | 1.2% | ||
| htotoo | 0 | 1,146,699,092 | 50% | ||
| azulear | 0 | 5,660,518,545 | 100% | ||
| mulletwang | 0 | 52,803,970,096 | 35% | ||
| akilie1029 | 0 | 6,510,179,327 | 100% | ||
| noloafing | 0 | 569,626,219 | 2.5% | ||
| thelordsharvest | 0 | 1,631,654,783 | 1.2% | ||
| kimzwarch | 0 | 10,992,219,253 | 4% | ||
| bradfordtennyson | 0 | 716,194,198 | 0.6% | ||
| accelerator | 0 | 67,125,483,149 | 5% | ||
| buildawhale | 0 | 7,768,413,874,151 | 10% | ||
| cloudspyder | 0 | 9,530,231,332 | 100% | ||
| calatorulmiop | 0 | 39,565,615,674 | 100% | ||
| therealwolf | 0 | 890,443,446,483 | 2.5% | ||
| sostrin | 0 | 8,808,665,334 | 25% | ||
| inthenow | 0 | 13,052,188,030 | 25% | ||
| revisesociology | 0 | 1,595,655,624 | 0.12% | ||
| upme | 0 | 576,930,889 | 0.6% | ||
| braveboat | 0 | 2,329,594,754 | 8% | ||
| dauerossi | 0 | 4,931,216,658 | 30% | ||
| makerhacks | 0 | 32,293,479,821 | 10% | ||
| meno | 0 | 10,411,276,342 | 0.6% | ||
| florian-glechner | 0 | 641,489,103 | 0.12% | ||
| carloserp-2000 | 0 | 10,225,347,310 | 100% | ||
| postpromoter | 0 | 432,756,365,373 | 10% | ||
| omstavan | 0 | 7,292,019,295 | 100% | ||
| steveconnor | 0 | 651,010,992 | 0.6% | ||
| sankysanket18 | 0 | 10,601,647,414 | 5% | ||
| smartsteem | 0 | 150,063,733,415 | 2.5% | ||
| fredkese | 0 | 4,525,682,486 | 11% | ||
| drmake | 0 | 655,994,082 | 0.6% | ||
| danile666 | 0 | 1,474,559,437 | 1.14% | ||
| aboutcoolscience | 0 | 4,918,576,767 | 10% | ||
| amestyj | 0 | 30,443,597,024 | 100% | ||
| itchyfeetdonica | 0 | 1,881,740,740 | 0.24% | ||
| kenadis | 0 | 2,587,320,932 | 10% | ||
| robotics101 | 0 | 2,829,594,678 | 10% | ||
| upmyvote | 0 | 7,422,413,899 | 10% | ||
| sonofsatoshi | 0 | 477,032,166 | 50% | ||
| sco | 0 | 4,494,294,992 | 10% | ||
| ennyta | 0 | 993,997,127 | 50% | ||
| juecoree | 0 | 1,750,468,657 | 7% | ||
| vjap55 | 0 | 1,250,249,917 | 100% | ||
| eliaschess333 | 0 | 4,277,853,889 | 50% | ||
| branbello | 0 | 921,426,608 | 5% | ||
| intrepidphotos | 0 | 367,191,978,729 | 7.5% | ||
| fineartnow | 0 | 630,726,291 | 0.6% | ||
| hijosdelhombre | 0 | 38,099,472,447 | 40% | ||
| aiziqi | 0 | 773,425,572 | 5% | ||
| communitybank | 0 | 1,814,248,285 | 1.2% | ||
| lonelywolf | 0 | 606,533,837 | 100% | ||
| fragmentarion | 0 | 2,263,497,668 | 10% | ||
| gaming.yer | 0 | 1,720,425,676 | 100% | ||
| hadji | 0 | 31,167,006,137 | 100% | ||
| utube | 0 | 920,177,830 | 1.2% | ||
| terrylovejoy | 0 | 1,312,612,023 | 4% | ||
| neneandy | 0 | 1,350,365,908 | 1.2% | ||
| goldrooster | 0 | 2,249,590,840 | 0.6% | ||
| tobias-g | 0 | 563,660,697 | 7.5% | ||
| yrmaleza | 0 | 2,819,904,712 | 50% | ||
| stemng | 0 | 1,705,383,837 | 10% | ||
| miguelangel2801 | 0 | 796,864,349 | 50% | ||
| upfundme | 0 | 466,314,098 | 6% | ||
| emiliomoron | 0 | 37,038,183,114 | 50% | ||
| yjcps | 0 | 3,849,293,719 | 100% | ||
| beverages | 0 | 1,596,339,985 | 0.6% | ||
| nenya | 0 | 782,751,162 | 100% | ||
| verhp11 | 0 | 1,041,179,986 | 1% | ||
| oghie | 0 | 666,929,989 | 50% | ||
| photohunt | 0 | 1,163,551,684 | 1.2% | ||
| geopolis | 0 | 626,285,284 | 10% | ||
| robertbira | 0 | 1,040,493,863 | 2.5% | ||
| alexdory | 0 | 11,964,359,410 | 10% | ||
| irgendwo | 0 | 27,609,418,244 | 25% | ||
| charitybot | 0 | 4,675,871,530 | 100% | ||
| cyprianj | 0 | 1,966,683,647 | 10% | ||
| citimillz | 0 | 1,160,152,818 | 0.6% | ||
| movement19 | 0 | 6,643,622,287 | 2.5% | ||
| doikao | 0 | 8,804,979,386 | 1.2% | ||
| francostem | 0 | 1,350,606,097 | 10% | ||
| endopediatria | 0 | 695,806,150 | 20% | ||
| technologix | 0 | 739,598,412 | 1.2% | ||
| chrislybear | 0 | 1,594,544,061 | 10% | ||
| vicesrus | 0 | 1,271,833,259 | 0.6% | ||
| croctopus | 0 | 1,570,410,912 | 100% | ||
| idkpdx | 0 | 0 | 0.6% | ||
| superlotto | 0 | 2,052,026,205 | 1.2% | ||
| bscrypto | 0 | 2,211,407,524 | 0.6% | ||
| movingman | 0 | 1,604,115,578 | 20% | ||
| delpilar | 0 | 934,959,443 | 25% | ||
| scottcbusiness | 0 | 764,516,062 | 0.6% | ||
| tomastonyperez | 0 | 17,118,554,130 | 50% | ||
| marcus0alameda | 0 | 937,873,970 | 50% | ||
| elvigia | 0 | 11,215,576,001 | 50% | ||
| sanderjansenart | 0 | 743,396,166 | 0.6% | ||
| sereze | 0 | 500,153,290 | 0.6% | ||
| lesmouths-travel | 0 | 765,310,544 | 10% | ||
| braaiboy | 0 | 2,010,601,809 | 0.9% | ||
| gadrian | 0 | 12,685,599,125 | 8% | ||
| tonimontana | 0 | 7,239,943,843 | 100% | ||
| fotogruppemunich | 0 | 549,002,488 | 0.18% | ||
| inciter | 0 | 48,861,715,581 | 100% | ||
| cryptocoinkb | 0 | 1,522,698,827 | 0.6% | ||
| gifty-e | 0 | 670,590,052 | 80% | ||
| scruffy23 | 0 | 20,043,725,346 | 50% | ||
| de-stem | 0 | 5,991,163,595 | 9.9% | ||
| josedelacruz | 0 | 9,306,486,776 | 50% | ||
| charitymemes | 0 | 534,493,884 | 100% | ||
| mariusfebruary | 0 | 1,310,228,998 | 0.48% | ||
| srijana-gurung | 0 | 22,343,774,846 | 50% | ||
| indigoocean | 0 | 1,548,467,698 | 0.6% | ||
| incubot | 0 | 1,221,435,151 | 0.9% | ||
| deholt | 0 | 540,970,686 | 8.5% | ||
| gwilberiol | 0 | 2,070,169,845 | 1.08% | ||
| netzisde | 0 | 1,584,205,483 | 1.2% | ||
| diabonua | 0 | 673,436,857 | 0.6% | ||
| crystalhuman | 0 | 738,982,718 | 10% | ||
| pladozero | 0 | 27,196,109,575 | 10% | ||
| nateaguila | 0 | 196,516,342,837 | 5% | ||
| enforcer48 | 0 | 112,910,922,849 | 15% | ||
| temitayo-pelumi | 0 | 758,295,503 | 10% | ||
| andrick | 0 | 866,365,209 | 50% | ||
| yusvelasquez | 0 | 18,858,885,962 | 50% | ||
| motherofalegend | 0 | 1,222,028,820 | 5% | ||
| dailyspam | 0 | 6,345,117,148 | 50% | ||
| uche-nna | 0 | 1,099,754,684 | 0.96% | ||
| anaestrada12 | 0 | 11,427,919,578 | 100% | ||
| hardaeborla | 0 | 519,863,777 | 0.6% | ||
| barbz | 0 | 85,640,712,237 | 100% | ||
| citizendog | 0 | 1,421,223,564 | 1.2% | ||
| cheese4ead | 0 | 680,803,990 | 0.6% | ||
| blewitt | 0 | 1,500,153,508 | 0.06% | ||
| karamyog | 0 | 1,481,079,350 | 100% | ||
| mindblast | 0 | 1,147,831,672 | 0.6% | ||
| urdreamscometrue | 0 | 7,432,453,423 | 100% | ||
| bflanagin | 0 | 863,931,910 | 0.6% | ||
| astrophoto.kevin | 0 | 1,011,839,792 | 5% | ||
| ubaldonet | 0 | 1,803,246,384 | 70% | ||
| armandosodano | 0 | 4,803,052,785 | 0.6% | ||
| yourmind | 0 | 14,593,947,339 | 100% | ||
| reinaseq | 0 | 6,511,276,964 | 100% | ||
| kylealex | 0 | 4,623,173,093 | 10% | ||
| orlandogonzalez | 0 | 4,716,880,964 | 25% | ||
| voxmortis | 0 | 874,004,496 | 0.5% | ||
| fran.frey | 0 | 4,214,477,344 | 50% | ||
| ummar | 0 | 840,857,193 | 5% | ||
| pboulet | 0 | 4,581,320,638 | 5% | ||
| marcocasario | 0 | 3,210,531,988 | 0.6% | ||
| stem-espanol | 0 | 73,135,420,080 | 100% | ||
| aleestra | 0 | 16,664,059,345 | 80% | ||
| the.success.club | 0 | 534,370,705 | 0.6% | ||
| amansharma555 | 0 | 595,961,049 | 100% | ||
| sincensura | 0 | 1,037,578,618 | 100% | ||
| dubignyp | 0 | 1,086,008,325 | 20% | ||
| brianoflondon | 0 | 2,191,633,150 | 0.18% | ||
| giulyfarci52 | 0 | 1,722,948,742 | 50% | ||
| esthersanchez | 0 | 7,625,830,963 | 60% | ||
| steemcryptosicko | 0 | 2,593,640,269 | 0.24% | ||
| nijn | 0 | 738,980,136 | 100% | ||
| adalger | 0 | 22,083,591,080 | 2% | ||
| solarphasing | 0 | 550,371,385 | 5% | ||
| cakemonster | 0 | 1,417,508,306 | 1.2% | ||
| stem.witness | 0 | 36,604,712,473 | 10% | ||
| quenty | 0 | 1,792,873,762 | 100% | ||
| theskmeister | 0 | 16,552,599,202 | 100% | ||
| robmojo | 0 | 2,404,968,317 | 1% | ||
| double-negative | 0 | 525,528,618 | 20% | ||
| wilmer14molina | 0 | 2,640,977,377 | 50% | ||
| bit4bit | 0 | 899,599,974 | 1.2% | ||
| michaias | 0 | 2,091,937,069 | 75% | ||
| vaultec | 0 | 3,006,244,321 | 12% | ||
| steemstorage | 0 | 1,444,094,452 | 1.2% | ||
| aqua.nano | 0 | 613,847,042 | 5% | ||
| jtm.support | 0 | 729,538,971 | 10% | ||
| nimloth | 0 | 1,167,173,312 | 100% | ||
| birdwatcher | 0 | 13,885,231,221 | 2% | ||
| juanbg | 0 | 1,669,749,564 | 10% | ||
| crowdwitness | 0 | 2,018,980,707 | 5% | ||
| hairgistix | 0 | 576,072,122 | 0.6% | ||
| limka | 0 | 175,167,422 | 100% | ||
| abbenay | 0 | 1,076,409,599 | 5% | ||
| steemean | 0 | 10,136,735,733 | 5% | ||
| newton666 | 0 | 9,270,847,364 | 100% | ||
| kggymlife | 0 | 5,858,490,867 | 20% | ||
| medro-martin | 0 | 1,723,577,094 | 10% | ||
| lefty619 | 0 | 834,955,805 | 1.2% | ||
| eliana-art | 0 | 1,063,814,052 | 100% | ||
| epicdice | 0 | 1,111,182,793 | 0.75% | ||
| edencourage | 0 | 6,324,042,284 | 50% | ||
| scholaris | 0 | 14,424,617,574 | 2.5% | ||
| morwen | 0 | 61,611,122,375 | 100% | ||
| fractalfrank | 0 | 1,190,085,209 | 0.6% | ||
| dragonblades | 0 | 526,069,790 | 100% | ||
| klima | 0 | 1,823,200,012 | 100% | ||
| map10k | 0 | 519,577,922 | 25% | ||
| reggaesteem | 0 | 532,428,229 | 5% | ||
| bedazzled | 0 | 21,111,681,128 | 100% | ||
| babytarazkp | 0 | 3,181,133,070 | 40% | ||
| capp | 0 | 6,104,934,294 | 50% | ||
| abh12345.stem | 0 | 2,807,023,564 | 100% | ||
| nazer | 0 | 673,716,443 | 5% | ||
| wanderingmoon | 0 | 4,719,492,691 | 50% | ||
| maxuvd | 0 | 27,669,831,114 | 8% | ||
| tmps | 0 | 1,076,462,092 | 6% | ||
| mister.reatard | 0 | 1,464,626,960 | 12.5% | ||
| midnightgenny | 0 | 2,705,210,643 | 100% | ||
| stemd | 0 | 313,569,382 | 100% | ||
| joshmania | 0 | 2,618,177,278 | 2.5% | ||
| khalstem | 0 | 1,493,087,228 | 100% | ||
| steemstem-trig | 0 | 745,889,177 | 10% | ||
| yggdrasil.laguna | 0 | 428,045,292 | 80% | ||
| ibt-survival | 0 | 38,989,763,188 | 10% | ||
| xerxes.alpha | 0 | 2,778,164,312 | 100% | ||
| hjmarseille | 0 | 1,009,169,853 | 7% | ||
| burnleoburn | 0 | 14,551,382 | 100% | ||
| chireerocks.stem | 0 | 132,460,095 | 100% | ||
| davidlionfish | 0 | 8,114,979,374 | 80% | ||
| traveledge | 0 | 829,790,956 | 100% | ||
| prize.hoard | 0 | 8,568,902,470 | 100% | ||
| fengchao | 0 | 9,197,077,968 | 2% | ||
| fsm-core | 0 | 9,802,442,140 | 50% | ||
| hornetsnest | 0 | 864,797,503 | 0.6% | ||
| stemsocial | 0 | 4,120,106,311 | 10% | ||
| quello | 0 | 722,740,433 | 7.5% | ||
| hiveonboard | 0 | 4,331,798,499 | 1.87% | ||
| nockzonk | 0 | 1,869,794,955 | 10% | ||
| rihc94 | 0 | 1,400,010,046 | 0.6% | ||
| localgrower | 0 | 6,808,137,785 | 5% | ||
| dna.org | 0 | 43,518,992,226 | 20% | ||
| poshbot | 0 | 6,458,696,968 | 10% | ||
| p3ntar0u | 0 | 12,895,542,390 | 90% | ||
| asa-raw | 0 | 985,360,217,225 | 25% | ||
| facilitymanager | 0 | 1,672,746,575 | 10% | ||
| recoveryinc | 0 | 3,488,601,530 | 5% | ||
| sevenoh-fiveoh | 0 | 606,818,531 | 5% | ||
| dying | 0 | 2,966,169,174 | 5% | ||
| discohedge | 0 | 4,423,627,576 | 6% | ||
| ctpsb | 0 | 51,975,761,284 | 2% | ||
| death-and-taxes | 0 | 3,810,379,170 | 50% | ||
| stemcur | 0 | 838,534,134 | 100% | ||
| brofund-stem | 0 | 2,348,276,386 | 80% | ||
| nathen007.stem | 0 | 628,294,202 | 100% | ||
| stemline | 0 | 10,160,243,830 | 100% | ||
| sillybilly | 0 | 0 | 10% | ||
| he-index | 0 | 9,639,079,871 | 20% | ||
| emrebeyler.stem | 0 | 1,486,302,293 | 100% | ||
| ctpsb.stem | 0 | 708,730,223 | 100% | ||
| scientician | 0 | 91,522,032 | 100% | ||
| pimpstudio-cash | 0 | 3,935,773,182 | 100% | ||
| ctpsb.cut | 0 | 705,511,712 | 20% | ||
| sanjeevm.stem | 0 | 3,139,758,807 | 100% | ||
| scholaris.stem | 0 | 1,722,738,813 | 100% | ||
| hypnochain | 0 | 0 | 1.2% | ||
| hive-163105 | 0 | 0 | 1.2% | ||
| brofi | 0 | 170,700,928 | 2.38% | ||
| jk6276.tribes | 0 | 13,973,462,144 | 10% |
<div class='text-justify'> <div class='pull-left'> <img src='https://stem.openhive.network/images/stemsocialsupport7.png'> </div> Thanks for your contribution to the STEMsocial community. Feel free to join us on discord to get to know the rest of us! Please consider <a href="https://hivesigner.com/sign/update-proposal-votes?proposal_ids=%5B91%5D&approve=true">supporting our funding proposal</a>, <a href="https://hivesigner.com/sign/account_witness_vote?approve=1&witness=stem.witness">approving our witness</a> (@stem.witness) or delegating to the @stemsocial account (for some ROI). Please consider using the <a href='https://stem.openhive.network'>STEMsocial app</a> app and including @stemsocial as a beneficiary to get a stronger support. <br /> <br />
| author | steemstem |
|---|---|
| permlink | re-dkmathstats-graphing-linear-inequalities-20210304t172604980z |
| category | hive-196387 |
| json_metadata | {"app":"stemsocial"} |
| created | 2021-03-04 17:26:06 |
| last_update | 2021-03-04 17:26:06 |
| depth | 1 |
| children | 0 |
| last_payout | 2021-03-11 17:26:06 |
| cashout_time | 1969-12-31 23:59:59 |
| total_payout_value | 0.000 HBD |
| curator_payout_value | 0.000 HBD |
| pending_payout_value | 0.000 HBD |
| promoted | 0.000 HBD |
| body_length | 778 |
| author_reputation | 262,017,435,115,313 |
| root_title | "Graphing Linear Inequalities" |
| beneficiaries | [] |
| max_accepted_payout | 1,000,000.000 HBD |
| percent_hbd | 10,000 |
| post_id | 102,182,155 |
| net_rshares | 0 |